|
 Django integration Django integration |
| Posted by GMalla on Mar-03-2008 12:28 |
|
Hi,
I'm using Django framework for my web application. How do i integrate chart director with Django custom views. In Django views define context and the context is passed to a html template. Html template creates output html file. My question is how to I pass a parameter to <IMG SRC="/home/simplebar.py"> . Because in Django the URLs do not end with .py extension. This again need to be mapped to a view function. I'm bit confuse.
Please help.
Thanks
GMalla |
| Re: Django integration |
| Posted by Peter Kwan on Mar-04-2008 02:31 |
|
Hi GMalla,
I have never used Django before. However, I have seen many frameworks, so I may provide some general ideas.
There are two methods to output a chart in a web page.
(1) Create the chart as an image file, then output the image file. For example, if you are using the sample code in "pythondemo/simplebar.py" (*not* the CGI one), it is creating the chart as a file "simplebar.png". So after crreating the chart, in your <IMG> tag, you may use <IMG SRC="/path/to/simplebar.png">.
If you use this method, the followings are several important things to note:
- To avoid confusion, you should use the full path name, not a relative path name. Some web frameworks will use some strange directory as the "current working directory", and your relative path name may end up relative to some strange place.
- Please be aware the path in the "makeChart" call is a file system path name, not a URL path. For example, "/aaa,png" means storing "aaa.png" in the root of the hard disk, not the root of your web directory. (Of course, the <IMG> tag path is a URL, as per HTML standard.)
- Make sure your web server has read and write access to the directory. By default, the web server, usually running as the anonymous user, may not write to the hard disk. For testing, you may want to set the directory to be readable and writable to anyone.
- The sample code uses a hard coded file name "simplebar.png". For a web server, you may want to use a unique file name, otherwise two users accessing the server at the same time will overwrite each other's files. The BaseChart.makeTmpFile method in ChartDirector may be useful for this purpose.
(2) Another method is to create the chart as an image in memory, then stream the image to the browser. Most well-developed web framework supports streaming of non-HTML content, such as images, movies, etc.. In the "pythondemo_cgi/simplebar.py" sample code, the following method is used to stream the content to the browser:
print "Content-type: image/png\n"
binaryPrint(c.makeChart2(PNG))
For your Django framework, you may need to read the Django documentation, or post questions to Django support or Django forum to ask if Django can stream non-HTML content. If it can, then you may replace the above two lines with the Django streaming code. In this case, the <IMG> tag is <IMG SRC="/path/to/yourDjangoCode.xxx"> where yourDjangoCode.xxx is the Django code that creates the chart and streams it to the browser.
If Django does not support non-HTML content, then you must use method (1) above.
Hope this can help.
Regards
Peter Kwan |
| Re: Django integration |
| Posted by Adrian on Mar-24-2008 21:28 |
|
A quick Django integration:
1) Add your URL pattern:
url(r'^test.png$', views.test, name='url_chart_test'),
2) create your view function:
from django.http import *
from pychartdir import *
def test(request):
data = [85, 156, 179.5, 211, 123]
labels = ["Mon", "Tue", "Wed", "Thu", "Fri"]
c = XYChart(250, 250)
c.setPlotArea(30, 20, 200, 200)
c.addBarLayer(data)
c.addBarLayer(data)
response = HttpResponse( mimetype='image/png')
response.write(c.makeChart2(PNG))
return response
3) in your html page, add a link to this "image"
<img src="/whatever/test.png"> |
| Re: Django integration |
| Posted by nmahale on Jan-17-2017 12:28 |
|
Hi
I am new to this forum.
Can you please explain how to integrate in Django server.
Becuase I am getting some errors while importing the DLLs.
Thanks
Adrian wrote:
A quick Django integration:
1) Add your URL pattern:
url(r'^test.png$', views.test, name='url_chart_test'),
2) create your view function:
from django.http import *
from pychartdir import *
def test(request):
data = [85, 156, 179.5, 211, 123]
labels = ["Mon", "Tue", "Wed", "Thu", "Fri"]
c = XYChart(250, 250)
c.setPlotArea(30, 20, 200, 200)
c.addBarLayer(data)
c.addBarLayer(data)
response = HttpResponse( mimetype='image/png')
response.write(c.makeChart2(PNG))
return response
3) in your html page, add a link to this "image"
<img src="/whatever/test.png">
|
| Re: Django integration |
| Posted by Peter Kwan on Jan-17-2017 22:22 |
|
Hi nmahale,
I have never used Django before, but I have just tried my following the tutorial in the Django web site, and I am able to set up ChartDirector with Django. ChartDirector currently can support up to Python 3.5. I am aware Python 3.6 was released a few days ago, but it is not yet supported.
1) First, download the ChartDirector for Python that suits for Python type. For exmaple, if your Python is 64-bit and is for Windows, please download "ChartDirector for Python" for Win64. Note that the 32-bit/64-bit refers to whether your Python is 32-bit or 64-bit, not your Windows. If you are using 32-bit Python on 64-bit Windows, you should still download 32-bit ChartDirector.
(2) As I have never used Django before and do not know where is its module search path, so I just copy the ChartDirector library (all files in "ChartDirector/lib") to the standard Python library directory (which in my case is "c:Python34lib" - it may differ depending on your Python distribution).
(3) I need to modify the code from Adrian to use "content_type" instead of "mimetype", because the latest version of Django has changed the name of the parameter. The exact code I used is;
from django.http import *
from pychartdir import *
def index(request):
data = [85, 156, 179.5, 211, 123]
labels = ["Mon", "Tue", "Wed", "Thu", "Fri"]
c = XYChart(250, 250)
c.setPlotArea(30, 20, 200, 200)
c.addBarLayer(data)
c.addBarLayer(data)
response = HttpResponse( content_type='image/png')
response.write(c.makeChart2(PNG))
return response
Hope this can help.
Regards
Peter Kwan |
| Re: Django integration |
| Posted by nmahale on Jan-19-2017 11:23 |
|
Thank you Peter for the help.
Actually I wanted to plot the graph with scrollbar and zoomin,zoomout in Django using python.Can you please help upon this. |
| Re: Django integration |
| Posted by Peter Kwan on Jan-20-2017 15:46 |
|
Hi nmahale,
Again, I have never used Django before. I have just tried to port the "Zooming and Scrolling with Track Line" sample code Django, and it seems to work only with minor modifications.
I have attached my entire Django web directory. I have only tried it using the development environment "manage.py", and I think the code requires Python 3.x. (If you use Python 2.x you may have to rename some Python libraries and their names may have changed.)
Basically, the code changes are:
(a) The path of the images, Javascript and other static files need to change. In my test code, it is changed to be in the "static" folder.
(b) In Python CGI, the query parameters are read using cgi.FieldStorage. In Django, it is using HttpRequest. As suggested my another post in this forum, you can add use the line below to copy the Django HttpRequest GET parameters to cgi.FieldStorage, so the original charting code does not need to be modified for accessing query parameters.
os.environ['QUERY_STRING'] = urllib.parse.urlencode( request.GET )
(c) In Python CGI, the output is just "print" out. (The CGI has I/O redirection to redirect it to the HTTP stream.) In Django, the HttpResponse object needs to be used to replace the "print" statement.
(d) In Python CGI, the URL refers to Python file. In Django, the refers to a method in a Python file. So the script "zoomscrolltrack.py" and the "getchart.py" needs to be moved to a method in a Python file (in my case it is in views.py), and the routes in "urls.py" be set up properly.
Hope this can help.
Regards
Peter Kwan
|
| Re: Django integration |
| Posted by nmahale on Jan-20-2017 16:11 |
|
Thank you so much Peter.
Just one observation ,I think thers some problem in Zoom In and Zoom out functionalities. Kindly help me with this.
Thanks
Neha |
| Re: Django integration |
| Posted by nmahale on Jan-20-2017 20:49 |
|
Hi Peter,
I could able to get data.But still unable to map data with times stamps.
I am getting data with time stamp in my file but not able to map it on chart.
Like when I scroll I want to see the data with Date and time to be displayed on that point.
Kindly help me with this.
Thanks
Neha |
| Re: Django integration |
| Posted by nmahale on Jan-20-2017 16:39 |
|
Hi Peter,
I am still unable to understand how to get data from my data base.
I am getting data in list or array format.
I could able to plot the data in my previous code using:-
c.setPlotArea(100, 20, 1200, 800)
c.addLineLayer(DataTemp)
c.xAxis().setLabels(LabelTemp).
Kindly help me with this.
Regards
Neha |
| Re: Django integration |
| Posted by nmahale on Jan-20-2017 20:54 |
|
Hi Peter,
I could able to get data.But still unable to map data with times stamps.
I am getting data with time stamp in my file but not able to map it on chart.
Like when I scroll I want to see the data with Date and time to be displayed on that point.
Also I want the data to be displayed day wise also.
Like if I zoom it down to day it should show hourly data .Basically I want Zoom in and zoom out functions.
Kindly help me with this.
Thanks
Neha
________________________________________ |
| Re: Django integration |
| Posted by Peter Kwan on Jan-21-2017 05:37 |
|
Hi Neha,
In older versions of Python (before 2.3), there is no data type for date/time in Python (note that a date/time in human language such as "01/01/2017" or "1st January 2017" is just a text string to Python, not a date/time). To solve this problem, in ChartDirector in Python, date/time needs to be represented as numbers. See:
http://www.advsofteng.com/doc/cdpython.htm#dateformat.htm
Given a date/time such as 2017-01-01 12:34:56, to create the number representing that date, the chartTime function can be used:
myDateTime = chartTime(2017, 1, 1, 12, 34, 56)
In Python, it is also common to use UNIX timestamps as date/time. Many database also has a method to retrieve date/time as UNIX timestamps (eg. the UNIX_TimeStamp function in MySQL). If your date/time is represented as UNIX timestamps, you can convert them to ChartDirector's representation using chartTime2, like:
myArrayOfDateTime = map(chartTime2, myArrayOfUnixTimeStamps)
For the Zooming and Scrolling with Track Line sample code, please make sure your data and timestamps are stored as arrays of numbers. For the timestamps, the numbers should be created using chartTime or chartTime2 as above.
Hope this can help.
Regards
Peter Kwan |
| Re: Django integration |
| Posted by nmahale on Jan-23-2017 11:45 |
|
Hi ,
I have tried this but stuck in something else.
I am trying to use attached (.py ) in my Views.py in Django
But I am getting "None" as output on web page.
Regards
Neha
|
| Re: Django integration |
| Posted by nmahale on Jan-23-2017 19:09 |
|
| Hi I am able to get this on webpage but getting error as attached.
|
| Re: Django integration |
| Posted by nmahale on Jan-23-2017 20:53 |
|
Hi Peter,
I have gone to the some extent and getting error as
(index):20 Uncaught TypeError: JsChartViewer.addEventListener is not a function(…).
I am attaching my "cdjcv.js" file.(size - 74,929 bytes)
I am using code of "pythondemo_cgiviewportcontroldemo.py"
I think there is some mismatch in these files.
Please share the file if any.
Thanks
Neha
|
| Re: Django integration |
| Posted by Peter Kwan on Jan-24-2017 01:00 |
|
Hi nmahale,
My "cdjcv.js" is exactly the same as yours, so I suspect it is not related to this file. May be for some reason, your browser does not load the "cdjcv.js" at all. Possibly reasons are incorrect HTML (without the <script> tag that loads the "cdjcv.js"), or the script is not loaded before the JsChartViewer.addEventListener is used, or the URL path to the "cdjcv.js" is incorrect, or there is some issue in the url mapping configuration in Django, etc..
Have you tried the "Zooming and Scrolling with Track Line" example in my last message? It also uses JsChartViewer.addEventListener and it appears to work correctly.
I have attached my copy of the "Viewport Control Demo" in Django. It is a complete Django web application and can be run using "python manage.py runserver".
If you need further help, it is useful if you can attach a complete web application that can be run using "python manage.py runserver" (similar to the one I attached), so I can try the code. It is because there are many possible reasons that JsChartViewer.addEventListener cannot be loaded, and we may need to run the code in order to debug it.
Regards
Peter Kwan
|
| Re: Django integration |
| Posted by nmahale on Jan-24-2017 11:17 |
|
Hi Peter,
Thank you so much for the help.
Even I have tried the same and was getting error.
I have tried running your code but still getting following error.
"Uncaught TypeError: JsChartViewer.addEventListener is not a function(…)"
Google Chrome Version 54.0.2840.99 m
As you have mentioned about"Zooming and Scrolling with Track Line" .
I have tried that also but still getting the same error as above.
Currently I am trying to use the Django solution provided by you but facing the issues as mentioned above.
Kindly help.
Regrads
Neha |
| Re: Django integration |
| Posted by Peter Kwan on Jan-24-2017 13:57 |
|
Hi nmahale,
I assume you are testing the my web application unmodified my going to the "mysite" folder and enter "python manage.py runserver". If you just copy the files to your own web applications or copy and paste the code or modify the code, there is a chance it may introduce errors.
Also, in your earlier message that shows the "Error 600 accessing server" screen shot, it seems the JsChartViewer.addEventListener is working normally at that time. If it does not work, you should not be able to move the "viewport control" at the bottom at all, and the browser would not even access the server. If you still have the code that produces the "Error 600" issue, may be you can try it again to see if it still produces "Error 600" and check if the "JsChartViewer.addEventListener" is working normally or not.
In modern browser, the:
JsChartViewer.addEventListener(window, 'load', function() {
can be replaced with:
window.onload = (function() {
In this way, the JsChartViewer.addEventListener would not be used at all.
For your reference, I have attached a screen shot to show what the page should look like when using "Developer Tools" in Chrome to view the source. If you need further help, is it possible to attach a similar screenshot?
Regards
Peter Kwan
|
| Re: Django integration |
| Posted by nmahale on Jan-24-2017 14:11 |
|
Hi Peter ,
Ya I am using the same way as suggested by you.
Now I am not getting the previous error but still I am getting
"Error 600 accessing error" when i try to Zoom it or use scroll bar.
And my web page gets stuck.
I am attaching screen shot for your ref.
Thanks for all the help
Regards
Neha
|
| Re: Django integration |
| Posted by Peter Kwan on Jan-25-2017 02:02 |
|
Hi nmahale,
At this stage, we can confirm the Javascript cdjcv.js is working.
In the sample web application I attached in my message, it is using the "mysite" directory. In the error message, it lists the directory as "D:/chartdir_python_win64/ChartDirector/pythondemo_cgi". So I assume it is not the sample code web application, but is your own web application.
I am not familiar with Django, but I suspect there is some configuration issue with the URL mapping. In the sample web application in my previous message, the URL issued by ChartDirector is "?cdLoopBack=1&......". It then maps to "http://localhost:8000/?cdLoopBack=1&.....".
May be you can try to print the SCRIPT_NAME out to see what the script thinks the URL path is. For example, you may include the os.environ["SCRIPT_NAME"] in the HTML output so we can see the SCRIPT_NAME. For example, you can change the viewPortCtrl.renderHTML() code (near the end of the script) to viewPortCtrl.renderHTML() + "<BR> [[[[" + os.environ["SCRIPT_NAME"] + "]]]" so that we can see the SCRIPT_NAME in the web page. The SCRIPT_NAME should be the URL path. For example, if the URL path is "http://localhost:8000/abcd/egfh", the SCRIPT_NAME should be "/abcd/efgh". If the URL path is "http://localhost:8000", the SCRIPT_NAME should be empty. (That's why I include "[[[[" and "]]]]" so you can still see something if the SCRIPT_NAME is empty.) If the SCRIPT_NAME is the file system path (eg. "file:///D:/chartdir_python_win64/ChartDirector/pythondemo_cgi"), not a URL path, there is something wrong in the URL mapping.
If the SCRIPT_NAME is incorrect, please try to configure your system to provide the correct SCRIPT_NAME, which should be the URL path. You can also try to display request.path_info too see if it is the correct URL path. If request.path_info is correct, but SCRIPT_NAME is not correct, you may try:
#This following line can be inserted after the loadResource = "/static/" line
os.environ["SCRIPT_NAME"] = request.path_info
to see if it can solve the problem. If it can solve the problem, we can confirm the issue is due to the SCRIPT_NAME.
Regards
Peter Kwan |
| Re: Django integration |
| Posted by nmahale on Jan-25-2017 14:33 |
|
Hi Peter ,
Thanks a lot.
Adding "os.environ["SCRIPT_NAME"] = request.path_info"
worked for me.
Now I am trying to get Hourly/Minutwise/Secondwise data.
I am getting data with proper time stamp
For example
I am getting data from my server in format
"{data}, {dd-mm-yyyy hh:mm:ss}"
"{232.32}, {25-01-2017 12:10:00}"
This I want to plot on my webpage
So I want to plot the data with this time stamp .
I want to zoom it down to hourly/minutes.
I am attaching the screen shot of trend created using cpp Chartdirector.
Also attaching the trend on web page where I am unable to show minutes and sceonds on label.
I wanted to plot the same graph on my web page.
I have used this
c.xAxis().setFormatCondition("else")
c.xAxis().setMultiFormat(StartOfHourFilter(), "<*font=bold*>{value|hh:nn:ss<*br*>dd hh}",
AllPassFilter(), "{value|nn:ss}")
But was unable to get data with corresponding label.
Seeking for help
Thanks
Neha
|
| Re: Django integration |
| Posted by Peter Kwan on Jan-26-2017 03:00 |
|
Hi nmahale,
I have tried your code. It works normally in my case.
What I have done is as follows. Starting from the sample code in my last message, change the random number generator so that it generates only 1 hour of data, with one data point per second.
#
# Initialize the WebChartViewer when the page is first loaded
#
def initViewer(viewer) :
# The full x-axis range is from Jan 1, 2007 to Jan 1, 2012
startDate = chartTime(2017, 1, 1, 0, 0, 0)
endDate = chartTime(2017, 1, 1, 1, 0, 0)
viewer.setFullRange("x", startDate, endDate)
# Initialize the view port to show the last 366 days (out of 1826 days)
viewer.setViewPortWidth(0.2)
viewer.setViewPortLeft(1 - viewer.getViewPortWidth())
# Set the maximum zoom to 10 days (out of 1826 days)
viewer.setZoomInWidthLimit(5.0 / 3600)
#
# Create a random table for demo purpose.
#
def getRandomTable() :
r = RanTable(127, 4, 3600)
r.setDateCol(0, chartTime(2017, 1, 1), 1)
r.setCol(1, 150, -10, 10)
r.setCol(2, 200, -10, 10)
r.setCol(3, 250, -8, 8)
return r
Then I replace the original code:
c.xAxis().setFormatCondition("else")
c.xAxis().setMultiFormat(StartOfDayFilter(), "<*font=bold*>{value|hh:nn<*br*>mmm dd}",
AllPassFilter(), "{value|hh:nn}")
with your code:
c.xAxis().setFormatCondition("else")
c.xAxis().setMultiFormat(StartOfHourFilter(), "<*font=bold*>{value|hh:nn:ss<*br*>dd hh}",
AllPassFilter(), "{value|nn:ss}")
When I zoomed to to a few seconds, the label format is using your code.
Note that in your case, it is quite possible the tick will be less than 1 second (eg. 0.5 second per tick). But in your format, there is no millsecond. So 12:34:56 and 12:34:56.5 will both be labelled as "34:56" as according to your format. I suggest you add a line to make sure the tick spacing is at least 1 second:
c.xAxis().setMinTickInc(1)
If in your case, the labels are not what you expect, the issue may be occur somewhere else in your code. To diagnose the problem, is it possible to provide a working example so I can reproduce the problem? You can modify your previous code to try to reproduce the problem and send the modified code to me.
Regards
Peter Kwan |
| Re: Django integration |
| Posted by nmahale on Jan-25-2017 18:47 |
|
Hi Peter
In addition to my above query I have one more doubt I want to send data from my web page to server.
Like in example we discussed have option of "Last 30 days"
I want to select the date from web page like Start Time and End Time will be provided by user.Accordingly data should get populated.
Thanks
Neha |
| Re: Django integration |
| Posted by Peter Kwan on Jan-26-2017 03:07 |
|
Hi nmahale,
The sample code is an example of how to configure the date range. If you look at the sample code, the "Last 30 days" link is used to call a method to change the viewport width and position to make the chart display the last 30 days. The method that changes the viewport width and position is viewer.setViewPortWidth and viewer.setViewPortLeft.
You can create a user interface to allow your user to choose the start and end date, then use them to modify the viewport like in the sample code, and the update the chart (in the sample code viewer.raiseViewPortChangedEvent is used to update the chart).
Hope this can help.
Regards
Peter Kwan |
| Re: Django integration |
| Posted by nmahale on Jan-27-2017 18:04 |
|
Hi Peter,
In your code you have used the "30 minutes selection" on that code itself.
In my case I wanted to send Start and End Dates to server may be using Ajax.
So can I write directly ajax queries in my views.py
For example
Following is my code which I have written for my other html pages .
Using this ajax I am sending data to server.
Same thing I want to implement in my chartdirector code.
function myFunction1(){
tags = ["webcb_2","webcb_3","webcb_4", "webcb_5","webcb_6","webcb_7","webcb_8","webcb_9",
"webcb_10","webcb_11","webcb_12","webcb_13","webcb_14","webcb_15"];
//tags = ["webcb_2","webcb_3"];
//console.log("tags are in before unniti svg are....",tags)
var my_dictionary = {};
my_dictionary['Tag'] = tags.join('|');
for(var tag in tags){
my_dictionary[tags[tag]] = document.getElementById(tags[tag]).textContent.trim();
//console.log("tags are in unniti svg are in loop....",tags[tag])
}
$.ajax({
url: '/ajax1/',
data:my_dictionary,
cache: false,
success: function (data) {
printData1(data, tags);
}
});
//window.setTimeout(myFunction1, 6000);
}
or can I use this directly in my views file.
I have attached my views.py file.
Kindly help me with this.
Thanks
Neha
|
| Re: Django integration |
| Posted by Peter Kwan on Jan-27-2017 22:20 |
|
Hi Neha,
The Zooming and Scrolling with Track Line sample code includes an example that shows how to send any user selection or custom information to the server. The sample code uses check boxes as example and sends the state of the check boxes to the server. See:
http://www.advsofteng.com/doc/cdpython.htm#zoomscrolltrackweb.htm
var checkBoxes = ["data0CheckBox", "data1CheckBox", "data2CheckBox"];
for (var i = 0; i < checkBoxes.length; ++i)
viewer.setCustomAttr(checkBoxes[i], document.getElementById(checkBoxes[i]).checked ? "T" : "F");
I think the above code is quite similar to your other AJAX code. Instead of copying the fields to "my_dictionary", in ChartDirector you can use viewer.setCustomAttr. In this way, when the chart is updated (eg. when the user press the "Update Chart" button), those information will be sent to the server and can be retrieved using viewer.getCustomAttr.
Hope this can help.
Regards
Peter Kwan |
| Re: Django integration |
| Posted by nmahale on Feb-01-2017 18:47 |
|
Hi Peter,
I am able to get dates.
I am getting data and time in two different arrays.
In last example we have used RandomTable() which was giving data and time in double array format.
I was trying to use "viewPortTimeStamps " function.
I am getting time in format
['2017-01-02 16:50:00.000', '2017-01-02 16:55:0
000', '2017-01-02 17:00:00.000', '2017-01-02 17:05:00.000', '2017-01-02 17:10:
.000', '2017-01-02 17:15:00.000', '2017-01-02 17:20:00.000', '2017-01-02 17:25
0.000', '2017-01-02 17:30:00.000', '2017-01-03 08:45:00.000', '2017-01-03 08:50']
It showing me error "Error converting argument 1 to type class DoubleArray".
Now I am getting data and time but unable to map my data with timestamp on my chart.
Kindly Help.
Regards
Neha |
| Re: Django integration |
| Posted by nmahale on Feb-01-2017 19:52 |
|
Hi Peter,
One more thing I have found out .
I have 38 nos. of data i.e. my data length is 38.
So the chart is plotting 38 points minutwise.
So only data of 38 minutes is available.
I want these data to be plotted as per user selection i.e. 5 minutes,15 minutes,etc.
For Example
If user select 15 minutes data should get plotted as
Data[1] - 02/01/2017 16:50:00
Data[2] - 02/01/2017 16:55:00
Data[3] - 02/01/2017 17:00:00
Data[4] - 02/01/2017 17:05:00...and so on
so these 38 entries should get spread over 38*15(minutes) = 570 minutes (7 hours 10 minutes)
Kindly help me with this.
Regards
Neha |
| Re: Django integration |
| Posted by Peter Kwan on Feb-02-2017 03:21 |
|
Hi Neha,
As according to your message, your array contains text strings '2017-01-02 16:50:00.000', which looks like a date/time in human language. However, in programming, you need to use programming language, not human language. Most programming language I know of (such as Python, C++, Java, C#, VB, PHP, ....) would not consider a text string to be a date/time. As the array does not contain date/time or numbers as according to the programming language, it causes the error.
For your case, you can parse the human readable text string to obtain the date/time components (year, month, day, hour, minute, second) as integers. You can then use those integers to construct the chartTime. For parsing, you may consider to use the Python function strptime. See:
https://docs.python.org/3/library/time.html#time.strptime
If your code provides the date/time, ChartDirector would know that the data points are 5 minutes or 15 minutes apart.
The full range of the chart is provided by your code. You can use another time range you like. In the sample code, it is like:
startDate = chartTime(2017, 1, 1, 0, 0, 0)
endDate = chartTime(2017, 1, 1, 1, 0, 0)
viewer.setFullRange("x", startDate, endDate)
In your real code, please obtain the actual startDate and endDate from your data, instead of hard coding the date/time.
Regards
Peter Kwan |
| Re: Django integration |
| Posted by nmahale on Feb-02-2017 11:09 |
|
Hi Peter,
Thanks for the help .
But as you said if code provides the date/time, ChartDirector would know that the data points are 5 minutes or 15 minutes apart.
I did not get that point.
Could you just tell me where I need to configure the things.I am also looking for same.
Regards
Neha |
| Re: Django integration |
| Posted by Peter Kwan on Feb-03-2017 02:24 |
|
Hi nmahale,
For your timestamps array, you can create one timestamp every 5 minutes. In your charting code, please make sure it uses the timestamps. It is like:
timestamps = [...... an array of date/time, with each element differs by 5 minutes ....]
layer = c.addLineLayer(myData, ....)
layer.setXData(timestamps)
As explained in my previous message, make sure the the date/time is created using chartTime or chartTime2.
Hope this can help.
Regards
Peter Kwan |
| Re: Django integration |
| Posted by nmahale on Mar-16-2017 12:50 |
|
Hi Peter,
It was a great help from your side.
Now i want to open graph on some desired area only on webpage.
When I click on button graph/plot should get open.
Till now I am able to open it in separate window on clicking of button.
Please find the attached image
Thanks
Neha
|
| Re: Django integration |
| Posted by Peter Kwan on Mar-17-2017 01:16 |
|
Hi nmahale,
You can use any normal HTML/Javascript techniques to show things in anywhere you like in your web page. For example, you can use an IFRAME like:
<IFRAME SRC="/path/to/zoomscrollchart" ......>
In the above, the URL is hard coded. You can use a button, so that when the user clicks the button, some Javascript is executed which set the SRC of the IFRAME to the chart you want to show, so you can use Javascript to dynamically create the <IFRAME> element and add it to your web page.
Regards
Peter Kwan |
| Re: Django integration |
| Posted by nmahale on Mar-17-2017 12:49 |
|
Hi Peter ,
Thanks for the help.
But I am trying this from Django where all my code is written in views.py in CGI.
I am not able to give absolute path not in my html nor in Views.py.
I have tried the solution suggested by you but its giving me blank as if no image source is available.
I am able to get other HTML pages as it on my selected area if write in this form,
--->>>return render(request, 'personal/abc.html')
but not able to do with trends/graph.
I have one more doubt I am trying to show the data as per time stamp.But in current philosophy it just dividing the data over that particular time period.
For example I have
Data as
data : 111 ,TS:16:03:2017 01:05:05
data : 114 ,TS:16:03:2017 11:05:05
data : 116 ,TS:16:03:2017 20:05:05
data : 112 ,TS:16:03:2017 20:35:05
data : 119 ,TS:16:03:2017 20:55:05
For lets say time range 16:03:2017 00:00:00 to 16:03:2017 23:59:59
So its just showing 5 equidistant points.
Not as per time stamp.
Kindly help me with this
Thanks
Neha |
| Re: Django integration |
| Posted by Peter Kwan on Mar-18-2017 01:33 |
|
Hi nmahale,
I am not familiar with Django. If you cannot use absolute path, surely you can use relative path. In your code, you use relative path 'personal/abc.html'.
Suppose you have a page that can display a chart, like:
http://www.chartdir.com/forum/download_thread.php?site=chartdir&bn=chartdir_support&thread=1204518493#N1485326004
You can certainly use any path you like for the page above. Let's use the path "aaaa".
Now can you include the following in your web page:
<a href="aaaa" target="bbbb">Click Me</a><br><iframe name="bbbb" width="800px" height="800px">
I am quite certain a Django web page can include the above lines. I tried myself with the follows in Django and it does produce the above lines.
def index(request):
return HttpResponse("<html><body><a href='aaaa' target='bbbb'>Click Me</a><br><iframe name='bbbb' width='800px' height='800px'></iframe></body></html>")
On the web page, there is a "Click Me" link. When you click on the link, it will display a page in the IFRAME.
Note that the above is just an example. You can use other methods. For example, the IFRAME can be created by Javascript instead of hard coded. The key point is that what you need to do is just HTML. Note that I have not touched the charting code at all.
Regards
Peter Kwan |
| Re: Django integration |
| Posted by nmahale on Mar-20-2017 19:23 |
|
Thanks for the help Peter.
But I am still unable to get it done.In last post I have mentioned I am returning some (.html ) files from my views.py.
like this "return render(request, 'personal/abc.html')"
I am trying to implement same in case of chart.
But I am not getting which file exactly should i return so it will generate chart in given area only.
Do I need to write the code in main views.py only or should i write in some different file.
Please help me with this.
Regards
Neha |
| Re: Django integration |
| Posted by Peter Kwan on Mar-21-2017 02:25 |
|
Hi nmahale,
I am never used Django before (except to support you earlier) and do not know what is "render". I look at Django documentation and it seems the "render" method does not support Python. So it is for return HTML. However, a chart is not HTML. it is a Python script.
Also, I think your original chart code is already in "views.py" and is returning the chart. If you prefer the charting code to be in "views.py", it is already in "views.py". See:
http://www.chartdir.com/forum/download_thread.php?site=chartdir&bn=chartdir_support&thread=1204518493#N1490009024
Although I have never used Django before, I tried to modify my earlier example so that the chart will appear in some location when the user clicks on a link. The charting code is exactly the same as in my earlier example in this thread and is still in "views.py". I just change the name or the function from "index" to "aaaa" for the charting code, and I use the "index" to display the main web page with a link for the user to click.
I have attached the views.py and the urls.py for your reference.
Again, this is to show you that what you need is not related to ChartDirector (the charting code has not changed at all), but is just how you write the web page.
Regards
Peter Kwan
| views.py |
|---|
from django.http import *
from pychartdir import *
def index(request):
return HttpResponse("<html><body><a href='aaaa' target='iframe1'>Click Me</a><br><iframe name='iframe1' width='800px' height='800px'></iframe></body></html>")
def aaaa(request):
os.environ["SCRIPT_NAME"] = request.path_info
response = ViewPortControl(request)
if not isinstance(response, HttpResponse):
response = HttpResponse(response)
return response
#
# Initialize the WebChartViewer when the page is first loaded
#
def initViewer(viewer) :
# The full x-axis range is from Jan 1, 2007 to Jan 1, 2012
startDate = chartTime(2010, 1, 1)
endDate = chartTime(2015, 1, 1)
viewer.setFullRange("x", startDate, endDate)
# Initialize the view port to show the last 366 days (out of 1826 days)
viewer.setViewPortWidth(366.0 / 1826)
viewer.setViewPortLeft(1 - viewer.getViewPortWidth())
# Set the maximum zoom to 10 days (out of 1826 days)
viewer.setZoomInWidthLimit(10.0 / 1826)
#
# Create a random table for demo purpose.
#
def getRandomTable() :
r = RanTable(127, 4, 1828)
r.setDateCol(0, chartTime(2010, 1, 1), 86400)
r.setCol(1, 150, -10, 10)
r.setCol(2, 200, -10, 10)
r.setCol(3, 250, -8, 8)
return r
#
# Draw the chart
#
def drawChart(viewer) :
# Determine the visible x-axis range
viewPortStartDate = viewer.getValueAtViewPort("x", viewer.getViewPortLeft())
viewPortEndDate = viewer.getValueAtViewPort("x", viewer.getViewPortLeft(
) + viewer.getViewPortWidth())
# We need to get the data within the visible x-axis range. In real code, this can be by using a
# database query or some other means as specific to the application. In this demo, we just
# generate a random data table, and then select the data within the table.
r = getRandomTable()
# Select the data for the visible date range viewPortStartDate to viewPortEndDate. It is
# possible there is no data point at exactly viewPortStartDate or viewPortEndDate. In this case,
# we also need the data points that are just outside the visible date range to "overdraw" the
# line a little bit (the "overdrawn" part will be clipped to the plot area) In this demo, we do
# this by adding a one day margin to the date range when selecting the data.
r.selectDate(0, viewPortStartDate - 86400, viewPortEndDate + 86400)
# The selected data from the random data table
timeStamps = r.getCol(0)
dataSeriesA = r.getCol(1)
dataSeriesB = r.getCol(2)
dataSeriesC = r.getCol(3)
#
# Now we have obtained the data, we can plot the chart.
#
#================================================================================
# Configure overall chart appearance.
#================================================================================
# Create an XYChart object of size 640 x 400 pixels
c = XYChart(640, 400)
# Set the plotarea at (55, 55) with width 80 pixels less than chart width, and height 90 pixels
# less than chart height. Use a vertical gradient from light blue (f0f6ff) to sky blue (a0c0ff)
# as background. Set border to transparent and grid lines to white (ffffff).
c.setPlotArea(55, 55, c.getWidth() - 80, c.getHeight() - 90, c.linearGradientColor(0, 55, 0,
c.getHeight() - 35, 0xf0f6ff, 0xa0c0ff), -1, Transparent, 0xffffff, 0xffffff)
# As the data can lie outside the plotarea in a zoomed chart, we need to enable clipping.
c.setClipping()
# Add a title box using dark grey (0x333333) 18pt Arial Bold font
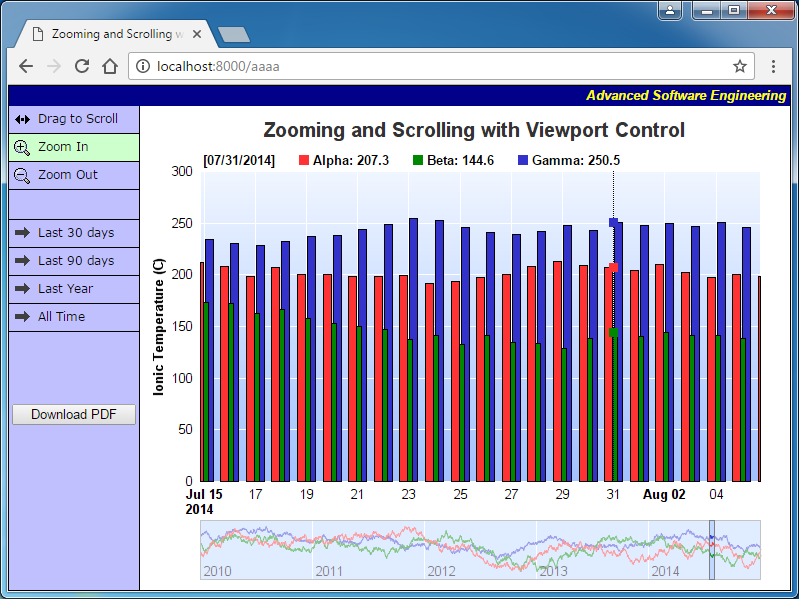
c.addTitle(" Zooming and Scrolling with Viewport Control", "arialbd.ttf", 15, 0x333333)
if viewer.isAttachmentRequest() :
b = c.addLegend(55, 28, 0, "arialbd.ttf", 10)
b.setBackground(Transparent, Transparent)
b.setLineStyleKey()
# Set the x and y axis stems to transparent and the label font to 10pt Arial
c.xAxis().setColors(Transparent)
c.yAxis().setColors(Transparent)
c.xAxis().setLabelStyle("arial.ttf", 10)
c.yAxis().setLabelStyle("arial.ttf", 10)
# Add axis title using 10pt Arial Bold font
c.yAxis().setTitle("Ionic Temperature (C)", "arialbd.ttf", 10)
#================================================================================
# Add data to chart
#================================================================================
#
# In this example, we represent the data by lines. You may modify the code below to use other
# layer types (areas, scatter plot, etc).
#
# Add a line layer for the lines, using a line width of 2 pixels
layer = c.addLineLayer2()
layer.setLineWidth(2)
# In this demo, we do not have too many data points. In real code, the chart may contain a lot
# of data points when fully zoomed out - much more than the number of horizontal pixels in this
# plot area. So it is a good idea to use fast line mode.
layer.setFastLineMode()
# Now we add the 3 data series to a line layer, using the color red (0xff3333), green (0x008800)
# and blue (0x3333cc)
layer.setXData(timeStamps)
layer.addDataSet(dataSeriesA, 0xff3333, "Alpha")
layer.addDataSet(dataSeriesB, 0x008800, "Beta")
layer.addDataSet(dataSeriesC, 0x3333cc, "Gamma")
#================================================================================
# Configure axis scale and labelling
#================================================================================
# Set the x-axis as a date/time axis with the scale according to the view port x range.
viewer.syncDateAxisWithViewPort("x", c.xAxis())
# For the automatic y-axis labels, set the minimum spacing to 30 pixels.
c.yAxis().setTickDensity(30)
#
# In this demo, the time range can be from a few years to a few days. We demonstrate how to set
# up different date/time format based on the time range.
#
# If all ticks are yearly aligned, then we use "yyyy" as the label format.
c.xAxis().setFormatCondition("align", 360 * 86400)
c.xAxis().setLabelFormat("{value|yyyy}")
# If all ticks are monthly aligned, then we use "mmm yyyy" in bold font as the first label of a
# year, and "mmm" for other labels.
c.xAxis().setFormatCondition("align", 30 * 86400)
c.xAxis().setMultiFormat(StartOfYearFilter(), "<*font=bold*>{value|mmm<*br*>yyyy}",
AllPassFilter(), "{value|mmm}")
# If all ticks are daily algined, then we use "mmm dd<*br*>yyyy" in bold font as the first label
# of a year, and "mmm dd" in bold font as the first label of a month, and "dd" for other labels.
c.xAxis().setFormatCondition("align", 86400)
c.xAxis().setMultiFormat(StartOfYearFilter(),
"<*block,halign=left*><*font=bold*>{value|mmm dd<*br*>yyyy}", StartOfMonthFilter(),
"<*font=bold*>{value|mmm dd}")
c.xAxis().setMultiFormat2(AllPassFilter(), "{value|dd}")
# For all other cases (sub-daily ticks), use "hh:nn<*br*>mmm dd" for the first label of a day,
# and "hh:nn" for other labels.
c.xAxis().setFormatCondition("else")
c.xAxis().setMultiFormat(StartOfDayFilter(), "<*font=bold*>{value|hh:nn<*br*>mmm dd}",
AllPassFilter(), "{value|hh:nn}")
#================================================================================
# Step 5 - Output the chart
#================================================================================
if viewer.isAttachmentRequest() :
# Output as PDF attachment
response = HttpResponse(content_type = "application/pdf")
response["Content-Disposition"] = "attachment; filename=\"viewportcontroldemo.pdf\""
response.write(c.makeChart2(PDF))
return response
else :
# Output the chart
chartQuery = c.makeTmpFile("/tmp/tmpcharts")
# Set the chart URL to the viewer
viewer.setImageUrl("getchart.py?img=/tmp/tmpcharts/" + chartQuery)
# Output Javascript chart model to the browser to support tracking cursor
viewer.setChartModel(c.getJsChartModel())
def drawFullChart(vp, viewer) :
# We need to draw a small thumbnail chart for the full data range. The simplest method is to
# simply get the full data to draw the chart. If the full data are very large (eg. millions of
# points), for such a small thumbnail chart, it is often acceptable to just retreive a small
# sample of the data.
#
# In this example, there are only around 5500 points for the 3 data series. This amount is not
# large to ChartDirector, so we simply pass all the data to ChartDirector.
r = getRandomTable()
# Get all the data from the random table
timeStamps = r.getCol(0)
dataSeriesA = r.getCol(1)
dataSeriesB = r.getCol(2)
dataSeriesC = r.getCol(3)
# Create an XYChart object of size 640 x 60 pixels
c = XYChart(640, 60)
# Set the plotarea with the same horizontal position as that in the main chart for alignment.
# The vertical position is set to equal to the chart height.
c.setPlotArea(55, 0, c.getWidth() - 80, c.getHeight() - 1, 0xc0d8ff, -1, 0x888888, Transparent,
0xffffff)
# Set the x axis stem to transparent and the label font to 10pt Arial
c.xAxis().setColors(Transparent)
c.xAxis().setLabelStyle("arial.ttf", 10)
# Put the x-axis labels inside the plot area by setting a negative label gap. Use
# setLabelAlignment to put the label at the right side of the tick.
c.xAxis().setLabelGap(-1)
c.xAxis().setLabelAlignment(1)
# Set the y axis stem and labels to transparent (that is, hide the labels)
c.yAxis().setColors(Transparent, Transparent)
# Add a line layer for the lines with fast line mode enabled
layer = c.addLineLayer2()
layer.setFastLineMode()
# Now we add the 3 data series to a line layer, using the color red (0xff3333), green (0x008800)
# and blue (0x3333cc)
layer.setXData(timeStamps)
layer.addDataSet(dataSeriesA, 0xff3333)
layer.addDataSet(dataSeriesB, 0x008800)
layer.addDataSet(dataSeriesC, 0x3333cc)
# The x axis scales should reflect the full range of the view port
c.xAxis().setDateScale(viewer.getValueAtViewPort("x", 0), viewer.getValueAtViewPort("x", 1))
# For the automatic x-axis labels, set the minimum spacing to 75 pixels.
c.xAxis().setTickDensity(75)
# For the auto-scaled y-axis, as we hide the labels, we can disable axis rounding. This can make
# the axis scale fit the data tighter.
c.yAxis().setRounding(0, 0)
# Output the chart
chartQuery = c.makeTmpFile("/tmp/tmpcharts")
# Set the chart URL and chart metrics to the viewport control
vp.setImageUrl("getchart.py?img=/tmp/tmpcharts/" + chartQuery)
vp.setChartMetrics(c.getChartMetrics())
def ViewPortControl(request) :
import cgi, sys, urllib, os
# Get HTTP query parameters
os.environ['QUERY_STRING'] = urllib.parse.urlencode( request.GET )
query = cgi.FieldStorage()
os.environ["SCRIPT_NAME"] = request.path_info
print ("My Path = %s" % (request.path_info))
#
# In this demo, the generated web page needs to load the "cdjcv.js" Javascript file and several GIF
# files. For ease of installation, we put these files in the same directory as this script. However,
# if this script is installed in a CGI only directory (such as cgi-bin), the web server would not
# allow the browser to access these non-CGI files.
#
# To get around this potential issue, a special load resource script is used to load these files.
# Instead of using:
#
# <SCRIPT SRC="cdjcv.js">
#
# we now use:
#
# <SCRIPT SRC="loadresource.py?file=cdjcv.js">
#
# Similar methods are used to load the GIF files.
#
# If this script is not in a CGI only directory, you may replace the following loadResource string
# with an empty string "" to improve performance.
#
loadResource = "/static/"
#
# This script handles both the full page request, as well as the subsequent partial updates (AJAX
# chart updates). We need to determine the type of request first before we processing it.
#
# Create the WebChartViewer object
viewer = WebChartViewer(query, "chart1")
if viewer.isPartialUpdateRequest() :
# Is a partial update request. Draw the chart and perform a partial response.
response = drawChart(viewer)
if not isinstance(response, HttpResponse) :
response = viewer.partialUpdateChart()
return response
#
# If the code reaches here, it is a full page request.
#
# Initialize the WebChartViewer and draw the chart.
initViewer(viewer)
drawChart(viewer)
# Create the WebViewPortControl object
viewPortCtrl = WebViewPortControl("fullchart1")
drawFullChart(viewPortCtrl, viewer)
return """
<!DOCTYPE html>
<html>
<head>
<title>Zooming and Scrolling with Viewport Control</title>
<script type="text/javascript" src="%(loadResource)scdjcv.js"></script>
<style type="text/css">
.chartButton { font:12px Verdana; border-bottom:#000000 1px solid; padding:5px; cursor:pointer;}
.chartButtonSpacer { font:12px Verdana; border-bottom:#000000 1px solid; padding:5px;}
.chartButton:hover { box-shadow:inset 0px 0px 0px 2px #444488; }
.chartButtonPressed { background-color: #CCFFCC; }
</style>
</head>
<body style="margin:0px;">
<script type="text/javascript">
//
// Execute the following initialization code after the web page is loaded
//
JsChartViewer.addEventListener(window, 'load', function() {
// Update the chart when the view port has changed (eg. when the user zooms in using the mouse)
var viewer = JsChartViewer.get('%(id)s');
viewer.attachHandler("ViewPortChanged", viewer.partialUpdate);
// Initialize the navigation pad
JsViewPortControl.get('%(viewPortCtrl.getId())s').setViewer(viewer);
// Draw track cursor when mouse is moving over plotarea or if the chart updates
viewer.attachHandler(["MouseMovePlotArea", "TouchStartPlotArea", "TouchMovePlotArea", "PostUpdate",
"Now", "ChartMove"], function(e) {
this.preventDefault(e); // Prevent the browser from using touch events for other actions
trackLineLegend(viewer, viewer.getPlotAreaMouseX());
});
});
//
// Draw track line with legend
//
function trackLineLegend(viewer, mouseX)
{
// Remove all previously drawn tracking object
viewer.hideObj("all");
// The chart and its plot area
var c = viewer.getChart();
var plotArea = c.getPlotArea();
// Get the data x-value that is nearest to the mouse, and find its pixel coordinate.
var xValue = c.getNearestXValue(mouseX);
var xCoor = c.getXCoor(xValue);
if (xCoor == null)
return;
// Draw a vertical track line at the x-position
viewer.drawVLine("trackLine", xCoor, plotArea.getTopY(), plotArea.getBottomY(), "black 1px dotted");
// Array to hold the legend entries
var legendEntries = [];
// Iterate through all layers to build the legend array
for (var i = 0; i < c.getLayerCount(); ++i)
{
var layer = c.getLayerByZ(i);
// The data array index of the x-value
var xIndex = layer.getXIndexOf(xValue);
// Iterate through all the data sets in the layer
for (var j = 0; j < layer.getDataSetCount(); ++j)
{
var dataSet = layer.getDataSetByZ(j);
// We are only interested in visible data sets with names, as they are required for legend entries.
var dataName = dataSet.getDataName();
var color = dataSet.getDataColor();
if ((!dataName) || (color == null))
continue;
// Build the legend entry, consist of a colored square box, the name and the data value.
var dataValue = dataSet.getValue(xIndex);
legendEntries.push("<nobr>" + viewer.htmlRect(10, 10, color) + " " + dataName + ": " +
((dataValue == null) ? "N/A" : dataValue.toPrecision(4)) + viewer.htmlRect(20, 0) + "</nobr> ");
// Draw a track dot for data points within the plot area
var yCoor = c.getYCoor(dataSet.getPosition(xIndex), dataSet.getUseYAxis());
if ((yCoor != null) && (yCoor >= plotArea.getTopY()) && (yCoor <= plotArea.getBottomY()))
{
viewer.showTextBox("dataPoint" + i + "_" + j, xCoor, yCoor, JsChartViewer.Center,
viewer.htmlRect(9, 9, color));
}
}
}
// Create the legend by joining the legend entries.
var legend = "<nobr>[" + c.xAxis().getFormattedLabel(xValue, "mm/dd/yyyy") + "]" + viewer.htmlRect(20, 0) +
"</nobr> " + legendEntries.reverse().join("");
// Display the legend on the top of the plot area
viewer.showTextBox("legend", plotArea.getLeftX(), plotArea.getTopY(), JsChartViewer.BottomLeft, legend,
"padding:0px 0px 3px 3px; font:bold 13px Arial; -webkit-text-size-adjust:100%%;");
}
//
// This method is called when the user clicks on the Pointer, Zoom In or Zoom Out buttons
//
function setMouseMode(mode)
{
var viewer = JsChartViewer.get('%(id)s');
if (mode == viewer.getMouseUsage())
mode = JsChartViewer.Default;
// Set the button color based on the selected mouse mode
document.getElementById("scrollButton").className = "chartButton" +
((mode == JsChartViewer.Scroll) ? " chartButtonPressed" : "");
document.getElementById("zoomInButton").className = "chartButton" +
((mode == JsChartViewer.ZoomIn) ? " chartButtonPressed" : "");
document.getElementById("zoomOutButton").className = "chartButton" +
((mode == JsChartViewer.ZoomOut) ? " chartButtonPressed" : "");
// Set the mouse mode
viewer.setMouseUsage(mode);
}
//
// This method is called when the user clicks on the buttons that selects the last NN days
//
function setTimeRange(duration)
{
var viewer = JsChartViewer.get('%(id)s');
// Set the view port width to represent the required duration (as a ratio to the total x-range)
viewer.setViewPortWidth(Math.min(1,
duration / (viewer.getValueAtViewPort("x", 1) - viewer.getValueAtViewPort("x", 0))));
// Set the view port left so that the view port is moved to show the latest data
viewer.setViewPortLeft(1 - viewer.getViewPortWidth());
// Trigger a view port change event
viewer.raiseViewPortChangedEvent();
}
</script>
<form method="post" id="ZoomScrollTrack" runat="server">
<table cellspacing="0" cellpadding="0" style="border:black 1px solid;">
<tr>
<td align="right" colspan="2" style="background:#000088; color:#ffff00; padding:0px 4px 2px 0px;">
<a style="color:#FFFF00; font:italic bold 10pt Arial; text-decoration:none" href="http://www.advsofteng.com/">
Advanced Software Engineering
</a>
</td>
</tr>
<tr valign="top">
<td style="width:130px; background:#c0c0ff;">
<div style="width:130px">
<!-- The following table is to create 3 cells for 3 buttons to control the mouse usage mode. -->
<table cellspacing="0" cellpadding="0" width="100%%" border="0">
<tr>
<td class="chartButton" id="scrollButton" onclick="setMouseMode(JsChartViewer.Scroll)"
ontouchstart="this.onclick(event); event.preventDefault();">
<img src="%(loadResource)sscrollew.gif" style="vertical-align:middle" alt="Drag" /> Drag to Scroll
</td>
</tr>
<tr>
<td class="chartButton" id="zoomInButton" onclick="setMouseMode(JsChartViewer.ZoomIn)"
ontouchstart="this.onclick(event); event.preventDefault();">
<img src="%(loadResource)szoomInIcon.gif" style="vertical-align:middle" alt="Zoom In" /> Zoom In
</td>
</tr>
<tr>
<td class="chartButton" id="zoomOutButton" onclick="setMouseMode(JsChartViewer.ZoomOut)"
ontouchstart="this.onclick(event); event.preventDefault();">
<img src="%(loadResource)szoomOutIcon.gif" style="vertical-align:middle" alt="Zoom Out" /> Zoom Out
</td>
</tr>
<tr>
<td class="chartButtonSpacer">
<div style="padding:2px"> </div>
</td>
</tr>
<tr>
<td class="chartButton" onclick="setTimeRange(30 * 86400);"
ontouchstart="this.onclick(event); event.preventDefault();">
<img src="%(loadResource)sgoto.gif" style="vertical-align:middle" alt="Last 30 days" /> Last 30 days
</td>
</tr>
<tr>
<td class="chartButton" onclick="setTimeRange(90 * 86400);"
ontouchstart="this.onclick(event); event.preventDefault();">
<img src="%(loadResource)sgoto.gif" style="vertical-align:middle" alt="Last 90 days" /> Last 90 days
</td>
</tr>
<tr>
<td class="chartButton" onclick="setTimeRange(366 * 86400);"
ontouchstart="this.onclick(event); event.preventDefault();">
<img src="%(loadResource)sgoto.gif" style="vertical-align:middle" alt="Last Year" /> Last Year
</td>
</tr>
<tr>
<td class="chartButton" onclick="setTimeRange(1E15);"
ontouchstart="this.onclick(event); event.preventDefault();">
<img src="%(loadResource)sgoto.gif" style="vertical-align:middle" alt="All Time" /> All Time
</td>
</tr>
</table>
<br />
<br />
<br />
<br />
<div style="text-align:center;">
<input type="button" value="Download PDF" style="font:13px Arial; width:124px;"
onclick="JsChartViewer.get('%(id)s').partialUpdateAsAttachment();" />
</div>
</div>
</td>
<td style="border-left:black 1px solid; padding:10px 5px 10px 5px;">
<!-- ****** Here is the chart image ****** -->
%(chartImg)s<br />
<!-- ****** Here is the viewport control ****** -->
%(viewPortCtrl.renderHTML())s
</td>
</tr>
</table>
</form>
</body>
</html>
""" % {
"loadResource" : loadResource,
"id" : viewer.getId(),
"viewPortCtrl.getId()" : viewPortCtrl.getId(),
"chartImg" : viewer.renderHTML(),
"viewPortCtrl.renderHTML()" : viewPortCtrl.renderHTML()
}
def getchart(request) :
import cgi, sys, string, urllib
os.environ['QUERY_STRING'] = urllib.parse.urlencode( request.GET )
query = cgi.FieldStorage()
filename = query["img"].value
if (hasattr(string, "find") and string.find or (lambda a, b: a.find(b)))(filename, "cd__") == -1 :
raise ('Filename "%s" does not seem created by ChartDirector' % filename)
extPos = (hasattr(string, "rfind") and string.rfind or (lambda a, b: a.rfind(b)))(filename, ".")
if extPos == -1 :
ext = "png"
else :
ext = (hasattr(string, "lower") and string.lower or (lambda a: a.lower()))(filename[extPos + 1:])
contentType = "image/png"
if ext == "gif" :
contentType = "image/gif"
elif ext == "jpg" or ext == "jpeg" :
contentType = "image/jpeg"
elif ext == "bmp" :
contentType = "image/bmp"
elif ext == "wmp" or ext == "wbmp" :
contentType = "image/vnd.wap.wbmp"
elif ext == "svg" or ext == "svgz" :
contentType = "image/svg+xml"
elif ext == "pdf" :
contentType = "application/pdf"
elif ext == "map" or ext == "gz" :
contentType = "text/html; charset=utf-8"
response = HttpResponse( content_type = contentType)
if ext == "gz" or ext == "svgz" :
response["Content-Encoding"] = "gzip"
if (hasattr(query, "has_key") and query.has_key or (lambda a, b = query: a in b))("filename") :
response["Content-Disposition"] = "inline; filename=%s" % query["filename"].value
f = open(filename, "rb")
response.write(f.read())
f.close()
return response
|
|
| urls.py |
|---|
"""mysite URL Configuration

The `urlpatterns` list routes URLs to views. For more information please see:
    https://docs.djangoproject.com/en/1.10/topics/http/urls/
Examples:
Function views
    1. Add an import:  from my_app import views
    2. Add a URL to urlpatterns:  url(r'^$', views.home, name='home')
Class-based views
    1. Add an import:  from other_app.views import Home
    2. Add a URL to urlpatterns:  url(r'^$', Home.as_view(), name='home')
Including another URLconf
    1. Import the include() function: from django.conf.urls import url, include
    2. Add a URL to urlpatterns:  url(r'^blog/', include('blog.urls'))
"""
from django.conf.urls import url
from django.contrib import admin

from . import views

urlpatterns = [
    url(r'^admin/', admin.site.urls),
	url(r'^$', views.index, name='index'),
	url(r'getchart.py', views.getchart, name='getchart'),
	url(r'aaaa', views.aaaa, name='aaaa')
]
|
| |
| Re: Django integration |
| Posted by nmahale on Mar-29-2017 16:15 |
|
Thanks for the support.
Now I have done with line charts I want to plot Overlapped Bar Chart with time stamp.
I was referring overlapbar.py script.
I could able to get bar chart but without zooming options.
Could you please help me with this.
Thanks |
| Re: Django integration |
| Posted by Peter Kwan on Mar-30-2017 01:54 |
|
Hi nmahale,
Starting with the code in my last message, I just change the line layer to a bar layer with overlapping bars and it works normally. Specifically, I change the lines:
layer = c.addLineLayer2()
layer.setLineWidth(2)
layer.setFastLineMode()
to
layer = c.addBarLayer2()
layer.setOverlapRatio(0.5)
and it produces an overlapping bar chart that can zoom and scroll.
Hope this can help.
Regards
Peter Kwan |
| Re: Django integration |
| Posted by nmahale on Mar-30-2017 11:41 |
|
Hi Peter,
Thanks for the help.
I have already added this piece of code
data0 = [100, 125, 156, 147, 87, 124, 178, 109, 140, 106, 192, 122]
data1 = [122, 156, 179, 211, 198, 177, 160, 220, 190, 188, 220, 270]
data2 = [167, 190, 213, 267, 250, 320, 212, 199, 245, 267, 240, 310]
labels = ["Jan", "Feb", "Mar", "Apr", "May", "Jun", "Jul", "Aug", "Sept", "Oct", "Nov", "Dec"]
c = XYChart(580, 280)
c.setPlotArea(55, 55, c.getWidth() - 80, c.getHeight() - 90, c.linearGradientColor(0, 55, 0,
c.getHeight() - 35, 0xf0f6ff, 0xa0c0ff), -1, Transparent, 0xffffff, 0xffffff)
c.addTitle("Product Revenue For Last 3 Years", "arialbi.ttf", 14)
c.setPlotArea(50, 50, 500, 200, 0xf8f8f8, 0xffffff)
c.addLegend(50, 25, 0, "arial.ttf", 8).setBackground(Transparent)
c.xAxis().setLabels(labels)
c.xAxis().setTickOffset(0.5)
# Add a multi-bar layer with 3 data sets
layer = c.addBarLayer2(Side)
layer.setOverlapRatio(0.5)
layer.addDataSet(data0, 0xff8080, "Year 2003")
layer.addDataSet(data1, 0x80ff80, "Year 2004")
layer.addDataSet(data2, 0x8080ff, "Year 2005")
But the bar chart is not changing.It is showing the same.
Still no zooming.
Please correct me if I am doing something incorrect.
Please find the screenshot.
Kindly share the screenshot if you have.
Regards
Neha
|
| Re: Django integration |
| Posted by Peter Kwan on Mar-30-2017 15:20 |
|
Hi nmahale,
I have attached the screen shot and the code for your reference. Note that I just modified the code for the main chart.
From your message, you mentioned you have "added" some code. You have not mentioned if you have "removed" some code too. If you "removed" the zooming code, there would be no zooming.
The code in my previous message assumes a date/time axis. For example, you can see the line "viewer.syncDateAxisWithViewPort" in the code. In my previous message, you mentioned you want to use "timestamps". However, in your attached code, there are no timestamps. In fact, there is no explicit x-coordinates, just labels. If you would like to use timestamps, at please timestamps as the x-coordinates. I believe you have already done that as you can plot the line with timestamps.
Regards
Peter Kwan
 |
| views.py |
|---|
from django.http import *
from pychartdir import *
def index(request):
return HttpResponse("<html><body><a href='aaaa' target='iframe1'>Click Me</a><br><iframe name='iframe1' width='800px' height='800px'></iframe></body></html>")
def aaaa(request):
os.environ["SCRIPT_NAME"] = request.path_info
response = ViewPortControl(request)
if not isinstance(response, HttpResponse):
response = HttpResponse(response)
return response
#
# Initialize the WebChartViewer when the page is first loaded
#
def initViewer(viewer) :
# The full x-axis range is from Jan 1, 2007 to Jan 1, 2012
startDate = chartTime(2010, 1, 1)
endDate = chartTime(2015, 1, 1)
viewer.setFullRange("x", startDate, endDate)
# Initialize the view port to show the last 366 days (out of 1826 days)
viewer.setViewPortWidth(366.0 / 1826)
viewer.setViewPortLeft(1 - viewer.getViewPortWidth())
# Set the maximum zoom to 10 days (out of 1826 days)
viewer.setZoomInWidthLimit(10.0 / 1826)
#
# Create a random table for demo purpose.
#
def getRandomTable() :
r = RanTable(127, 4, 1828)
r.setDateCol(0, chartTime(2010, 1, 1), 86400)
r.setCol(1, 150, -10, 10)
r.setCol(2, 200, -10, 10)
r.setCol(3, 250, -8, 8)
return r
#
# Draw the chart
#
def drawChart(viewer) :
# Determine the visible x-axis range
viewPortStartDate = viewer.getValueAtViewPort("x", viewer.getViewPortLeft())
viewPortEndDate = viewer.getValueAtViewPort("x", viewer.getViewPortLeft(
) + viewer.getViewPortWidth())
# We need to get the data within the visible x-axis range. In real code, this can be by using a
# database query or some other means as specific to the application. In this demo, we just
# generate a random data table, and then select the data within the table.
r = getRandomTable()
# Select the data for the visible date range viewPortStartDate to viewPortEndDate. It is
# possible there is no data point at exactly viewPortStartDate or viewPortEndDate. In this case,
# we also need the data points that are just outside the visible date range to "overdraw" the
# line a little bit (the "overdrawn" part will be clipped to the plot area) In this demo, we do
# this by adding a one day margin to the date range when selecting the data.
r.selectDate(0, viewPortStartDate - 86400, viewPortEndDate + 86400)
# The selected data from the random data table
timeStamps = r.getCol(0)
dataSeriesA = r.getCol(1)
dataSeriesB = r.getCol(2)
dataSeriesC = r.getCol(3)
#
# Now we have obtained the data, we can plot the chart.
#
#================================================================================
# Configure overall chart appearance.
#================================================================================
# Create an XYChart object of size 640 x 400 pixels
c = XYChart(640, 400)
# Set the plotarea at (55, 55) with width 80 pixels less than chart width, and height 90 pixels
# less than chart height. Use a vertical gradient from light blue (f0f6ff) to sky blue (a0c0ff)
# as background. Set border to transparent and grid lines to white (ffffff).
c.setPlotArea(55, 55, c.getWidth() - 80, c.getHeight() - 90, c.linearGradientColor(0, 55, 0,
c.getHeight() - 35, 0xf0f6ff, 0xa0c0ff), -1, Transparent, 0xffffff, 0xffffff)
# As the data can lie outside the plotarea in a zoomed chart, we need to enable clipping.
c.setClipping()
# Add a title box using dark grey (0x333333) 18pt Arial Bold font
c.addTitle(" Zooming and Scrolling with Viewport Control", "arialbd.ttf", 15, 0x333333)
if viewer.isAttachmentRequest() :
b = c.addLegend(55, 28, 0, "arialbd.ttf", 10)
b.setBackground(Transparent, Transparent)
b.setLineStyleKey()
# Set the x and y axis stems to transparent and the label font to 10pt Arial
c.xAxis().setColors(Transparent)
c.yAxis().setColors(Transparent)
c.xAxis().setLabelStyle("arial.ttf", 10)
c.yAxis().setLabelStyle("arial.ttf", 10)
# Add axis title using 10pt Arial Bold font
c.yAxis().setTitle("Ionic Temperature (C)", "arialbd.ttf", 10)
#================================================================================
# Add data to chart
#================================================================================
#
# In this example, we represent the data by lines. You may modify the code below to use other
# layer types (areas, scatter plot, etc).
#
# Add a line layer for the lines, using a line width of 2 pixels
layer = c.addBarLayer2()
layer.setOverlapRatio(0.5)
#layer.setLineWidth(2)
# In this demo, we do not have too many data points. In real code, the chart may contain a lot
# of data points when fully zoomed out - much more than the number of horizontal pixels in this
# plot area. So it is a good idea to use fast line mode.
#layer.setFastLineMode()
# Now we add the 3 data series to a line layer, using the color red (0xff3333), green (0x008800)
# and blue (0x3333cc)
layer.setXData(timeStamps)
layer.addDataSet(dataSeriesA, 0xff3333, "Alpha")
layer.addDataSet(dataSeriesB, 0x008800, "Beta")
layer.addDataSet(dataSeriesC, 0x3333cc, "Gamma")
#================================================================================
# Configure axis scale and labelling
#================================================================================
# Set the x-axis as a date/time axis with the scale according to the view port x range.
viewer.syncDateAxisWithViewPort("x", c.xAxis())
# For the automatic y-axis labels, set the minimum spacing to 30 pixels.
c.yAxis().setTickDensity(30)
#
# In this demo, the time range can be from a few years to a few days. We demonstrate how to set
# up different date/time format based on the time range.
#
# If all ticks are yearly aligned, then we use "yyyy" as the label format.
c.xAxis().setFormatCondition("align", 360 * 86400)
c.xAxis().setLabelFormat("{value|yyyy}")
# If all ticks are monthly aligned, then we use "mmm yyyy" in bold font as the first label of a
# year, and "mmm" for other labels.
c.xAxis().setFormatCondition("align", 30 * 86400)
c.xAxis().setMultiFormat(StartOfYearFilter(), "<*font=bold*>{value|mmm<*br*>yyyy}",
AllPassFilter(), "{value|mmm}")
# If all ticks are daily algined, then we use "mmm dd<*br*>yyyy" in bold font as the first label
# of a year, and "mmm dd" in bold font as the first label of a month, and "dd" for other labels.
c.xAxis().setFormatCondition("align", 86400)
c.xAxis().setMultiFormat(StartOfYearFilter(),
"<*block,halign=left*><*font=bold*>{value|mmm dd<*br*>yyyy}", StartOfMonthFilter(),
"<*font=bold*>{value|mmm dd}")
c.xAxis().setMultiFormat2(AllPassFilter(), "{value|dd}")
# For all other cases (sub-daily ticks), use "hh:nn<*br*>mmm dd" for the first label of a day,
# and "hh:nn" for other labels.
c.xAxis().setFormatCondition("else")
c.xAxis().setMultiFormat(StartOfDayFilter(), "<*font=bold*>{value|hh:nn<*br*>mmm dd}",
AllPassFilter(), "{value|hh:nn}")
#================================================================================
# Step 5 - Output the chart
#================================================================================
if viewer.isAttachmentRequest() :
# Output as PDF attachment
response = HttpResponse(content_type = "application/pdf")
response["Content-Disposition"] = "attachment; filename=\"viewportcontroldemo.pdf\""
response.write(c.makeChart2(PDF))
return response
else :
# Output the chart
chartQuery = c.makeTmpFile("/tmp/tmpcharts")
# Set the chart URL to the viewer
viewer.setImageUrl("getchart.py?img=/tmp/tmpcharts/" + chartQuery)
# Output Javascript chart model to the browser to support tracking cursor
viewer.setChartModel(c.getJsChartModel())
def drawFullChart(vp, viewer) :
# We need to draw a small thumbnail chart for the full data range. The simplest method is to
# simply get the full data to draw the chart. If the full data are very large (eg. millions of
# points), for such a small thumbnail chart, it is often acceptable to just retreive a small
# sample of the data.
#
# In this example, there are only around 5500 points for the 3 data series. This amount is not
# large to ChartDirector, so we simply pass all the data to ChartDirector.
r = getRandomTable()
# Get all the data from the random table
timeStamps = r.getCol(0)
dataSeriesA = r.getCol(1)
dataSeriesB = r.getCol(2)
dataSeriesC = r.getCol(3)
# Create an XYChart object of size 640 x 60 pixels
c = XYChart(640, 60)
# Set the plotarea with the same horizontal position as that in the main chart for alignment.
# The vertical position is set to equal to the chart height.
c.setPlotArea(55, 0, c.getWidth() - 80, c.getHeight() - 1, 0xc0d8ff, -1, 0x888888, Transparent,
0xffffff)
# Set the x axis stem to transparent and the label font to 10pt Arial
c.xAxis().setColors(Transparent)
c.xAxis().setLabelStyle("arial.ttf", 10)
# Put the x-axis labels inside the plot area by setting a negative label gap. Use
# setLabelAlignment to put the label at the right side of the tick.
c.xAxis().setLabelGap(-1)
c.xAxis().setLabelAlignment(1)
# Set the y axis stem and labels to transparent (that is, hide the labels)
c.yAxis().setColors(Transparent, Transparent)
# Add a line layer for the lines with fast line mode enabled
layer = c.addLineLayer2()
layer.setFastLineMode()
# Now we add the 3 data series to a line layer, using the color red (0xff3333), green (0x008800)
# and blue (0x3333cc)
layer.setXData(timeStamps)
layer.addDataSet(dataSeriesA, 0xff3333)
layer.addDataSet(dataSeriesB, 0x008800)
layer.addDataSet(dataSeriesC, 0x3333cc)
# The x axis scales should reflect the full range of the view port
c.xAxis().setDateScale(viewer.getValueAtViewPort("x", 0), viewer.getValueAtViewPort("x", 1))
# For the automatic x-axis labels, set the minimum spacing to 75 pixels.
c.xAxis().setTickDensity(75)
# For the auto-scaled y-axis, as we hide the labels, we can disable axis rounding. This can make
# the axis scale fit the data tighter.
c.yAxis().setRounding(0, 0)
# Output the chart
chartQuery = c.makeTmpFile("/tmp/tmpcharts")
# Set the chart URL and chart metrics to the viewport control
vp.setImageUrl("getchart.py?img=/tmp/tmpcharts/" + chartQuery)
vp.setChartMetrics(c.getChartMetrics())
def ViewPortControl(request) :
import cgi, sys, urllib, os
# Get HTTP query parameters
os.environ['QUERY_STRING'] = urllib.parse.urlencode( request.GET )
query = cgi.FieldStorage()
os.environ["SCRIPT_NAME"] = request.path_info
print ("My Path = %s" % (request.path_info))
#
# In this demo, the generated web page needs to load the "cdjcv.js" Javascript file and several GIF
# files. For ease of installation, we put these files in the same directory as this script. However,
# if this script is installed in a CGI only directory (such as cgi-bin), the web server would not
# allow the browser to access these non-CGI files.
#
# To get around this potential issue, a special load resource script is used to load these files.
# Instead of using:
#
# <SCRIPT SRC="cdjcv.js">
#
# we now use:
#
# <SCRIPT SRC="loadresource.py?file=cdjcv.js">
#
# Similar methods are used to load the GIF files.
#
# If this script is not in a CGI only directory, you may replace the following loadResource string
# with an empty string "" to improve performance.
#
loadResource = "/static/"
#
# This script handles both the full page request, as well as the subsequent partial updates (AJAX
# chart updates). We need to determine the type of request first before we processing it.
#
# Create the WebChartViewer object
viewer = WebChartViewer(query, "chart1")
if viewer.isPartialUpdateRequest() :
# Is a partial update request. Draw the chart and perform a partial response.
response = drawChart(viewer)
if not isinstance(response, HttpResponse) :
response = viewer.partialUpdateChart()
return response
#
# If the code reaches here, it is a full page request.
#
# Initialize the WebChartViewer and draw the chart.
initViewer(viewer)
drawChart(viewer)
# Create the WebViewPortControl object
viewPortCtrl = WebViewPortControl("fullchart1")
drawFullChart(viewPortCtrl, viewer)
return """
<!DOCTYPE html>
<html>
<head>
<title>Zooming and Scrolling with Viewport Control</title>
<script type="text/javascript" src="%(loadResource)scdjcv.js"></script>
<style type="text/css">
.chartButton { font:12px Verdana; border-bottom:#000000 1px solid; padding:5px; cursor:pointer;}
.chartButtonSpacer { font:12px Verdana; border-bottom:#000000 1px solid; padding:5px;}
.chartButton:hover { box-shadow:inset 0px 0px 0px 2px #444488; }
.chartButtonPressed { background-color: #CCFFCC; }
</style>
</head>
<body style="margin:0px;">
<script type="text/javascript">
//
// Execute the following initialization code after the web page is loaded
//
JsChartViewer.addEventListener(window, 'load', function() {
// Update the chart when the view port has changed (eg. when the user zooms in using the mouse)
var viewer = JsChartViewer.get('%(id)s');
viewer.attachHandler("ViewPortChanged", viewer.partialUpdate);
// Initialize the navigation pad
JsViewPortControl.get('%(viewPortCtrl.getId())s').setViewer(viewer);
// Draw track cursor when mouse is moving over plotarea or if the chart updates
viewer.attachHandler(["MouseMovePlotArea", "TouchStartPlotArea", "TouchMovePlotArea", "PostUpdate",
"Now", "ChartMove"], function(e) {
this.preventDefault(e); // Prevent the browser from using touch events for other actions
trackLineLegend(viewer, viewer.getPlotAreaMouseX());
});
});
//
// Draw track line with legend
//
function trackLineLegend(viewer, mouseX)
{
// Remove all previously drawn tracking object
viewer.hideObj("all");
// The chart and its plot area
var c = viewer.getChart();
var plotArea = c.getPlotArea();
// Get the data x-value that is nearest to the mouse, and find its pixel coordinate.
var xValue = c.getNearestXValue(mouseX);
var xCoor = c.getXCoor(xValue);
if (xCoor == null)
return;
// Draw a vertical track line at the x-position
viewer.drawVLine("trackLine", xCoor, plotArea.getTopY(), plotArea.getBottomY(), "black 1px dotted");
// Array to hold the legend entries
var legendEntries = [];
// Iterate through all layers to build the legend array
for (var i = 0; i < c.getLayerCount(); ++i)
{
var layer = c.getLayerByZ(i);
// The data array index of the x-value
var xIndex = layer.getXIndexOf(xValue);
// Iterate through all the data sets in the layer
for (var j = 0; j < layer.getDataSetCount(); ++j)
{
var dataSet = layer.getDataSetByZ(j);
// We are only interested in visible data sets with names, as they are required for legend entries.
var dataName = dataSet.getDataName();
var color = dataSet.getDataColor();
if ((!dataName) || (color == null))
continue;
// Build the legend entry, consist of a colored square box, the name and the data value.
var dataValue = dataSet.getValue(xIndex);
legendEntries.push("<nobr>" + viewer.htmlRect(10, 10, color) + " " + dataName + ": " +
((dataValue == null) ? "N/A" : dataValue.toPrecision(4)) + viewer.htmlRect(20, 0) + "</nobr> ");
// Draw a track dot for data points within the plot area
var yCoor = c.getYCoor(dataSet.getPosition(xIndex), dataSet.getUseYAxis());
if ((yCoor != null) && (yCoor >= plotArea.getTopY()) && (yCoor <= plotArea.getBottomY()))
{
viewer.showTextBox("dataPoint" + i + "_" + j, xCoor, yCoor, JsChartViewer.Center,
viewer.htmlRect(9, 9, color));
}
}
}
// Create the legend by joining the legend entries.
var legend = "<nobr>[" + c.xAxis().getFormattedLabel(xValue, "mm/dd/yyyy") + "]" + viewer.htmlRect(20, 0) +
"</nobr> " + legendEntries.reverse().join("");
// Display the legend on the top of the plot area
viewer.showTextBox("legend", plotArea.getLeftX(), plotArea.getTopY(), JsChartViewer.BottomLeft, legend,
"padding:0px 0px 3px 3px; font:bold 13px Arial; -webkit-text-size-adjust:100%%;");
}
//
// This method is called when the user clicks on the Pointer, Zoom In or Zoom Out buttons
//
function setMouseMode(mode)
{
var viewer = JsChartViewer.get('%(id)s');
if (mode == viewer.getMouseUsage())
mode = JsChartViewer.Default;
// Set the button color based on the selected mouse mode
document.getElementById("scrollButton").className = "chartButton" +
((mode == JsChartViewer.Scroll) ? " chartButtonPressed" : "");
document.getElementById("zoomInButton").className = "chartButton" +
((mode == JsChartViewer.ZoomIn) ? " chartButtonPressed" : "");
document.getElementById("zoomOutButton").className = "chartButton" +
((mode == JsChartViewer.ZoomOut) ? " chartButtonPressed" : "");
// Set the mouse mode
viewer.setMouseUsage(mode);
}
//
// This method is called when the user clicks on the buttons that selects the last NN days
//
function setTimeRange(duration)
{
var viewer = JsChartViewer.get('%(id)s');
// Set the view port width to represent the required duration (as a ratio to the total x-range)
viewer.setViewPortWidth(Math.min(1,
duration / (viewer.getValueAtViewPort("x", 1) - viewer.getValueAtViewPort("x", 0))));
// Set the view port left so that the view port is moved to show the latest data
viewer.setViewPortLeft(1 - viewer.getViewPortWidth());
// Trigger a view port change event
viewer.raiseViewPortChangedEvent();
}
</script>
<form method="post" id="ZoomScrollTrack" runat="server">
<table cellspacing="0" cellpadding="0" style="border:black 1px solid;">
<tr>
<td align="right" colspan="2" style="background:#000088; color:#ffff00; padding:0px 4px 2px 0px;">
<a style="color:#FFFF00; font:italic bold 10pt Arial; text-decoration:none" href="http://www.advsofteng.com/">
Advanced Software Engineering
</a>
</td>
</tr>
<tr valign="top">
<td style="width:130px; background:#c0c0ff;">
<div style="width:130px">
<!-- The following table is to create 3 cells for 3 buttons to control the mouse usage mode. -->
<table cellspacing="0" cellpadding="0" width="100%%" border="0">
<tr>
<td class="chartButton" id="scrollButton" onclick="setMouseMode(JsChartViewer.Scroll)"
ontouchstart="this.onclick(event); event.preventDefault();">
<img src="%(loadResource)sscrollew.gif" style="vertical-align:middle" alt="Drag" /> Drag to Scroll
</td>
</tr>
<tr>
<td class="chartButton" id="zoomInButton" onclick="setMouseMode(JsChartViewer.ZoomIn)"
ontouchstart="this.onclick(event); event.preventDefault();">
<img src="%(loadResource)szoomInIcon.gif" style="vertical-align:middle" alt="Zoom In" /> Zoom In
</td>
</tr>
<tr>
<td class="chartButton" id="zoomOutButton" onclick="setMouseMode(JsChartViewer.ZoomOut)"
ontouchstart="this.onclick(event); event.preventDefault();">
<img src="%(loadResource)szoomOutIcon.gif" style="vertical-align:middle" alt="Zoom Out" /> Zoom Out
</td>
</tr>
<tr>
<td class="chartButtonSpacer">
<div style="padding:2px"> </div>
</td>
</tr>
<tr>
<td class="chartButton" onclick="setTimeRange(30 * 86400);"
ontouchstart="this.onclick(event); event.preventDefault();">
<img src="%(loadResource)sgoto.gif" style="vertical-align:middle" alt="Last 30 days" /> Last 30 days
</td>
</tr>
<tr>
<td class="chartButton" onclick="setTimeRange(90 * 86400);"
ontouchstart="this.onclick(event); event.preventDefault();">
<img src="%(loadResource)sgoto.gif" style="vertical-align:middle" alt="Last 90 days" /> Last 90 days
</td>
</tr>
<tr>
<td class="chartButton" onclick="setTimeRange(366 * 86400);"
ontouchstart="this.onclick(event); event.preventDefault();">
<img src="%(loadResource)sgoto.gif" style="vertical-align:middle" alt="Last Year" /> Last Year
</td>
</tr>
<tr>
<td class="chartButton" onclick="setTimeRange(1E15);"
ontouchstart="this.onclick(event); event.preventDefault();">
<img src="%(loadResource)sgoto.gif" style="vertical-align:middle" alt="All Time" /> All Time
</td>
</tr>
</table>
<br />
<br />
<br />
<br />
<div style="text-align:center;">
<input type="button" value="Download PDF" style="font:13px Arial; width:124px;"
onclick="JsChartViewer.get('%(id)s').partialUpdateAsAttachment();" />
</div>
</div>
</td>
<td style="border-left:black 1px solid; padding:10px 5px 10px 5px;">
<!-- ****** Here is the chart image ****** -->
%(chartImg)s<br />
<!-- ****** Here is the viewport control ****** -->
%(viewPortCtrl.renderHTML())s
</td>
</tr>
</table>
</form>
</body>
</html>
""" % {
"loadResource" : loadResource,
"id" : viewer.getId(),
"viewPortCtrl.getId()" : viewPortCtrl.getId(),
"chartImg" : viewer.renderHTML(),
"viewPortCtrl.renderHTML()" : viewPortCtrl.renderHTML()
}
def getchart(request) :
import cgi, sys, string, urllib
os.environ['QUERY_STRING'] = urllib.parse.urlencode( request.GET )
query = cgi.FieldStorage()
filename = query["img"].value
if (hasattr(string, "find") and string.find or (lambda a, b: a.find(b)))(filename, "cd__") == -1 :
raise ('Filename "%s" does not seem created by ChartDirector' % filename)
extPos = (hasattr(string, "rfind") and string.rfind or (lambda a, b: a.rfind(b)))(filename, ".")
if extPos == -1 :
ext = "png"
else :
ext = (hasattr(string, "lower") and string.lower or (lambda a: a.lower()))(filename[extPos + 1:])
contentType = "image/png"
if ext == "gif" :
contentType = "image/gif"
elif ext == "jpg" or ext == "jpeg" :
contentType = "image/jpeg"
elif ext == "bmp" :
contentType = "image/bmp"
elif ext == "wmp" or ext == "wbmp" :
contentType = "image/vnd.wap.wbmp"
elif ext == "svg" or ext == "svgz" :
contentType = "image/svg+xml"
elif ext == "pdf" :
contentType = "application/pdf"
elif ext == "map" or ext == "gz" :
contentType = "text/html; charset=utf-8"
response = HttpResponse( content_type = contentType)
if ext == "gz" or ext == "svgz" :
response["Content-Encoding"] = "gzip"
if (hasattr(query, "has_key") and query.has_key or (lambda a, b = query: a in b))("filename") :
response["Content-Disposition"] = "inline; filename=%s" % query["filename"].value
f = open(filename, "rb")
response.write(f.read())
f.close()
return response
|
| |
| Re: Django integration |
| Posted by nmahale on Mar-30-2017 16:39 |
|
Hi Peter,
Thanks for all the help.
I have raised a query a long back as
I have one more doubt I am trying to show the data as per time stamp.But in current philosophy it just dividing the data over that particular time period.
For example I have
Data as
data : 111 ,TS:16:03:2017 01:05:05
data : 114 ,TS:16:03:2017 11:05:05
data : 116 ,TS:16:03:2017 20:05:05
data : 112 ,TS:16:03:2017 20:35:05
data : 119 ,TS:16:03:2017 20:55:05
For lets say time range 16:03:2017 00:00:00 to 16:03:2017 23:59:59
So its just showing 5 equidistant points.
not as per time stamp.
Data should get displayed as per time which has obtained from data base not just plotting of equivalent points.
Kindly help me with this
Regards
Neha |
| Re: Django integration |
| Posted by Peter Kwan on Mar-31-2017 02:16 |
|
Hi nmahale,
If the timestamps are not regularly spaced, and the timestamps are used as x-coordinates (in Layer.setXData), then the data points will not be equidistant. However, if you do not use the timestamps as x-coordinates, then ChartDirector does not know what are the x-coordinates, so it will plot everything as equidistant.
Note that x-axis labels are not the same as x-coordinates. x-axis labels configured using Axis.setLabels are just names. For example, "16:03:2017 01:05:05", "Apple", "Elephant", "Monday" can be used as x-axis labels. They have no meaning at all to the computer and are just displayed for human reading.
An example of using uneven x-coordinates is:
http://www.advsofteng.com/doc/cdpython.htm#unevenpoints.htm
Hope this can help.
Regards
Peter Kwan |
| Re: Django integration |
| Posted by nmahale on Apr-03-2017 19:26 |
|
Hello Peter,
Thank you so much for all the help.
I have issue while accessing trends using FullChart Function.
When I give dates and asks for the data it shows nothing on trend.I need to scroll the bar which is below the main trend then only I can view the data.
The behavior is OK in PC/Laptop but when I try to do same thing on mobile.I can not scroll the bar which is below main trend.
Can you just help me with settings so that bar gets automatically displayed without using scroll bar.
I am attaching screenshots for your ref.
|
| Re: Django integration |
| Posted by Peter Kwan on Apr-04-2017 02:18 |
|
Hi nmahale,
From your screen shot, the viewport is initially configured to display from viewport position 0 to 0, which means only the data point at the beginning of the x range is displayed. If you want to display the full x range, please set the viewport as 0 to 1 (viewport left = 0, viewport width = 1). Would you mind to clarify how does you set the viewport position?
Regards
Peter Kwan |
| Re: Django integration |
| Posted by nmahale on Apr-04-2017 11:46 |
|
Hi Peter,
Please find my piece of code
<tr>
<td class="chartButton" onclick="TestDates(1E15);"
ontouchstart="this.onclick(event); event.preventDefault();">
<img src="%(loadResource)sgoto.gif" style="vertical-align:middle" alt="Get Dates1" /> Get Trend
</td>
</tr>
function TestDates(duration)
{
var viewer = JsChartViewer.get('%(id)s');
// Set the view port width to represent the required duration (as a ratio to the total x-range)
viewer.setViewPortWidth(Math.min(1,
duration / (viewer.getValueAtViewPort("x", 1) - viewer.getValueAtViewPort("x", 0))));
// Set the view port left so that the view port is moved to show the latest data
viewer.setViewPortLeft(1 - viewer.getViewPortWidth());
// Trigger a view port change event
viewer.raiseViewPortChangedEvent();
}
What I found is if I double click on "GET TRENDS" I get the expected result.
But on single click same result as previous..
I tried
viewer.setViewPortWidth(1)
viewer.setViewPortLeft(0)
also.But same result. |
| Re: Django integration |
| Posted by Peter Kwan on Apr-05-2017 02:39 |
|
Hi nmahale,
I have just tried your code, and it works normally in the sample code included in my previous message in this thread. The exact code I use is:
<td class="chartButton" onclick="TestDates(1E15);"
ontouchstart="this.onclick(event); event.preventDefault();">
<img src="%(loadResource)sgoto.gif" style="vertical-align:middle" alt="Get Dates1" /> Get Trend
</td>
</tr>
<script>
function TestDates(duration)
{
var viewer = JsChartViewer.get('%(id)s');
viewer.setViewPortLeft(0);
viewer.setViewPortWidth(1);
viewer.raiseViewPortChangedEvent();
}
</script>
Please try it using the sample code in my previous message, not your real code. This is to confirm that it works normally. Then you can try it in your real code. If it does not work in your real code, it means your real code or your real data is different from the sample code, and the issue is related to the difference.
As I do have your real code or data and cannot run your code, it is hard for me to determine what is the difference. May be you can try to determine the difference, as you have both the real code and the working sample code. and can run both of them.
If you can provide me with a complete example that I can run and that can reproduce the problem, I would be able to trouble-shoot for you.
Regards
Peter Kwan |
| Re: Django integration |
| Posted by nmahale on Apr-06-2017 11:36 |
|
Thanks for all the help Peter.
Need your suggestion on following points
1.How to show data on hourly basis separated by 1 hour interval
2.on graph time is showing as mm/dd/yyyy format .
I want to change it to dd/mm/yyyy format.
Thanks |
| Re: Django integration |
| Posted by Peter Kwan on Apr-07-2017 03:17 |
|
Hi nmahale,
I have just changed the random data code to use hourly data in the sample code in my previous message, and it works normally. Specially, I change the random data to generate data for the year 2015, and with 1 point every hour.
#
# Initialize the WebChartViewer when the page is first loaded
#
def initViewer(viewer) :
# The full x-axis range is from Jan 1, 2007 to Jan 1, 2012
startDate = chartTime(2015, 1, 1)
endDate = chartTime(2016, 1, 1)
viewer.setFullRange("x", startDate, endDate)
# Initialize the view port to show the last 366 days (out of 1826 days)
viewer.setViewPortWidth(366.0 / 1826)
viewer.setViewPortLeft(1 - viewer.getViewPortWidth())
# Set the maximum zoom to 1 day
viewer.setZoomInWidthLimit(1.0 / 365)
#
# Create a random table for demo purpose.
#
def getRandomTable() :
r = RanTable(127, 4, 365 * 24)
r.setDateCol(0, chartTime(2015, 1, 1), 3600)
r.setCol(1, 150, -10, 10)
r.setCol(2, 200, -10, 10)
r.setCol(3, 250, -8, 8)
return r
In the sample code, the date format is configured using:
c.xAxis().setMultiFormat(StartOfYearFilter(),
"<*block,halign=left*><*font=bold*>{value|mmm dd<*br*>yyyy}", StartOfMonthFilter(),
"<*font=bold*>{value|mmm dd}")
If you want "dd/mm/yyyy", please change the format to "dd/mm/yyyy" in the above code. If you have not added any code for the formatting, you can use Axis.setLabelFormat to configure a fixed format for all labels, or you can use setFormatCondition/setMultiFormat to configure different format for different time ranges as in the sample code.
Regards
Peter Kwan |
| Re: Django integration |
| Posted by nmahale on Apr-07-2017 13:25 |
|
Hi Peter
I am getting following error when I try to run chart on other machines.
cdDll = __import__("pychartdir" + cdSysVer[0] + cdSysVer[2])
ImportError: No module named 'pychartdir34'
Kindly suggest
Thanks |
| Re: Django integration |
| Posted by Peter Kwan on Apr-08-2017 00:29 |
|
Hi nmahale,
This message means that the Python cannot find ChartDirector. Some possible reasons are:
(a) ChartDirector are not installed in the Python module path of the target machine
(b) The operating system edition of ChartDirector does not match the operating system type of the Python interpreter. For example, using Win 32-bit ChartDirector with Linux (x86_64) Python, or using Win 32-bit ChartDirector is used with Win 64-bit Python will cause this issue.
In particular, not that the operating system of your machine is not important. The important part is the operating system type of your Python interpreter. You can install and use Windows 32-bit Python even on a Windows 64-bit operating system. In this case, the operating system type of the Python interpreter is Windows 32-bit, not Windows 64-bit, and the ChartDirector should also be Windows 32-bit.
Would you mind to double check if you have installed ChartDirector for Python in the target system, or that the ChartDirector for Python library is in the Python module search path of the target system? Also, please verify if the operating system edition of ChartDirector matches with that of the Python interpreter.
Regards
Peter Kwan |
| Re: Django integration |
| Posted by nmahale on Apr-08-2017 15:04 |
|
Hi Peter ,
I have solved the issue its because of environment variables settings.
No I want to draw real time trend in Django Web App .
I am referring realtimetrack.py code.
But getting output as "None".
Kindly suggest |
| Re: Django integration |
| Posted by nmahale on Apr-11-2017 11:08 |
|
Hi Peter ,
I have solved the issue its because of environment variables settings.
Now I want to draw real time trend in Django using Python Chartdiretcor .
I am referring realtimetrack.py code.
But getting output as "None".
Kindly suggest |
| Re: Django integration |
| Posted by Peter Kwan on Apr-11-2017 11:34 |
|
Hi nmahale,
Is it possible to provide the Django version of the Real-Time Chart with Track Line sample code that you have made for testing? It is quite hard for me to troubleshoot your code without seeing your code.
Regards
Peter Kwan |
| Re: Django integration |
| Posted by nmahale on Apr-11-2017 12:07 |
|
Hi Peter,
I have attached my piece of code here.
I am using ajax to send the "RefName" .For which data will get displayed.
This "RefName" will pass to my server.My server will respond to request and it will send the data using "Server Sent Events" to get real time updated data.
I am getting data as list using SSE .This SSE data I want to update as per time and change in data.
Please suggest.
|
| Re: Django integration |
| Posted by nmahale on Apr-11-2017 12:23 |
|
Attachments: Download
Hi Peter,
I have attached my piece of code here.
I am using ajax to send the "RefName" .For which data will get displayed.
This "RefName" will pass to my server.My server will respond to request and it will send the data using "Server Sent Events" to get real time updated data.
I am getting data as list using SSE .This SSE data I want to update as per time and change in data.
Please suggest.
|
| Re: Django integration |
| Posted by Peter Kwan on Apr-12-2017 04:58 |
|
Hi nmahale,
I cannot run your code, as it is incomplete (eg. it depends on "module1"). In any case, I am not in a suitable position to debug your code. So I remove the code I cannot run and just leave the charting part, and it works normally. I have attached the code that I have tested, and is the same as your "views.py", but with the parts that depends on your code removed.
I am not sure part of the code you think is behaving abnormally. If it is the part that I removed, please debug your code to make sure it works. For example, if your AJAX code is not working, please debug your AJAX code. If you think all your code is working, and there is still an issue in generating the chart, please explain in more detail what you is the issue. If you just mention it does not work, it is hard for me to trouble-shoot the issue, as I cannot even run your code.
Regards
Peter Kwan
| views.py |
|---|
from django.http import *
from pychartdir import *
import cgi, math

def display_chart(request):
  viewer = WebChartViewer(request, 'chart1')
  if viewer.isPartialUpdateRequest():
      #.. set up the partial update call..
      return HttpResponse( viewer.partialUpdateChart() )
  #...draw the chart here call
  # remainder of code to return the full response


def index(request):
	response = ViewPortControl(request)
	if not isinstance(response, HttpResponse):
		response = HttpResponse(response)
	return response


def initViewer(viewer) :
	# The full x-axis range is from Jan 1, 2007 to Jan 1, 2012
	startDate = chartTime(2010, 1, 1)
	endDate = chartTime(2015, 1, 1)
	viewer.setFullRange("x", startDate, endDate)

	# Initialize the view port to show the last 366 days (out of 1826 days)
	viewer.setViewPortWidth(366.0 / 1826)
	viewer.setViewPortLeft(1 - viewer.getViewPortWidth())

	# Set the maximum zoom to 10 days (out of 1826 days)
	viewer.setZoomInWidthLimit(10.0 / 1826)

#
# Create a random table for demo purpose.
#
def getRandomTable() :
	r = RanTable(127, 4, 1828)
	r.setDateCol(0, chartTime(2010, 1, 1), 86400)
	r.setCol(1, 150, -10, 10)
	r.setCol(2, 200, -10, 10)
	r.setCol(3, 250, -8, 8)
	return r

#
query = cgi.FieldStorage()
loadResource = "loadresource.py?file="


def drawChart(viewer) :
#
# Draw the chart
#
#
    # Data to draw the chart. In this demo, the data buffer will be filled by a random data
    # generator. In real life, the data is probably stored in a buffer (eg. a database table, a text
    # file, or some global memory) and updated by other means.
    #

    # We use a data buffer to emulate the last 240 samples.

    sampleSize = 240
    dataSeries1 = [0] * sampleSize
    #dataSeries1 = message
    dataSeries2 = [0] * sampleSize
    dataSeries3 = [0] * sampleSize
    timeStamps = [0] * sampleSize

    # Our pseudo random number generator
    firstDate = chartTime2(time.time()) - len(timeStamps)
    for i in range(0, len(timeStamps)) :
        p = firstDate + i
        timeStamps[i] = p
        dataSeries1[i] = math.cos(p * 2.1) * 10 + 1 / (math.cos(p) * math.cos(p) + 0.01) + 20
        dataSeries2[i] = 100 * math.sin(p / 27.7) * math.sin(p / 10.1) + 150
    c = XYChart(600, 270, 0xf4f4f4, 0x000000, 0)
    c.setRoundedFrame()
    c.setPlotArea(55, 57, 520, 185, 0xffffff, -1, -1, 0xcccccc, 0xcccccc)
    c.setClipping()
    c.addTitle("Field Intensity at Observation Satellite", "timesbi.ttf", 15).setBackground(
        0xdddddd, 0x000000, glassEffect())
    c.yAxis().setTitle("Intensity (V/m)", "arialbd.ttf", 10)
    c.xAxis().setTickDensity(75, 15)

    # Set the axes width to 2 pixels
    c.xAxis().setWidth(2)
    c.yAxis().setWidth(2)
    c.xAxis().setLabelFormat("{value|hh:nn:ss}")
    layer = c.addLineLayer2()
    layer.setXData(timeStamps)
    layer.addDataSet(dataSeries1, 0xff0000, "Alpha")
    layer.addDataSet(dataSeries2, 0x00cc00, "Beta")
    layer.addDataSet(dataSeries3, 0x0000ff, "Gamma")
    chartQuery = c.makeTmpFile("/tmp/tmpcharts")
    viewer.setImageUrl("getchart.py?img=/tmp/tmpcharts/" + chartQuery)
    viewer.setChartModel(c.getJsChartModel())
    if viewer.isAttachmentRequest() :
        response = HttpResponse(content_type = "application/pdf")
        response["Content-Disposition"] = "attachment; filename=\"viewportcontroldemo.pdf\""
        response.write(c.makeChart2(PDF))
        return response
    else :
        chartQuery = c.makeTmpFile("/tmp/tmpcharts")
        viewer.setImageUrl("getchart.py?img=/tmp/tmpcharts/" + chartQuery)
        viewer.setChartModel(c.getJsChartModel())
# Create the WebChartViewer object
viewer = WebChartViewer(query, "chart1")

if viewer.isPartialUpdateRequest() :
    # Is a partial update request. Draw the chart and perform a partial response.
    drawChart(viewer)
    binaryPrint(viewer.partialUpdateChart())
    sys.exit()

#
# If the code reaches here, it is a full page request.
#

drawChart(viewer)


def ViewPortControl(request) :

	import cgi, sys, urllib

	# Get HTTP query parameters
	os.environ['QUERY_STRING'] = urllib.parse.urlencode( request.GET )
	query = cgi.FieldStorage()

	#
	# In this demo, the generated web page needs to load the "cdjcv.js" Javascript file and several GIF
	# files. For ease of installation, we put these files in the same directory as this script. However,
	# if this script is installed in a CGI only directory (such as cgi-bin), the web server would not
	# allow the browser to access these non-CGI files.
	#
	# To get around this potential issue, a special load resource script is used to load these files.
	# Instead of using:
	#
	#    <SCRIPT SRC="cdjcv.js">
	#
	# we now use:
	#
	#    <SCRIPT SRC="loadresource.py?file=cdjcv.js">
	#
	# Similar methods are used to load the GIF files.
	#
	# If this script is not in a CGI only directory, you may replace the following loadResource string
	# with an empty string "" to improve performance.
	#
	loadResource = "/static/"
	os.environ["SCRIPT_NAME"] = request.path_info


	#
	# This script handles both the full page request, as well as the subsequent partial updates (AJAX
	# chart updates). We need to determine the type of request first before we processing it.
	#

	# Create the WebChartViewer object
	viewer = WebChartViewer(query, "chart1")

	if viewer.isPartialUpdateRequest() :
		# Is a partial update request. Draw the chart and perform a partial response.
		response = drawChart(viewer)
		if not isinstance(response, HttpResponse) :
			response = viewer.partialUpdateChart()
		return response

	#
	# If the code reaches here, it is a full page request.
	#

	# Initialize the WebChartViewer and draw the chart.
	initViewer(viewer)
	#print("DRAWWWWWWWWWWWWWWW CHARTTTTTTTTTTTTTTTTTTTTTT.......",tempChartFlag)
	drawChart(viewer)

	# Create the WebViewPortControl object
	viewPortCtrl = WebViewPortControl("fullchart1")
	#drawFullChart(viewPortCtrl, viewer)

	print("Content-type: text/html\n")
	return """
<!DOCTYPE html>
<html>
<head>
    <title>Realtime Chart with Track Line</title>
    <script type="text/javascript" src="%(loadResource)scdjcv.js"></script>
	<link rel="stylesheet" href="//ajax.googleapis.com/ajax/libs/jqueryui/1.11.1/themes/smoothness/jquery-ui.css">
<script src="//ajax.googleapis.com/ajax/libs/jquery/1.11.1/jquery.min.js"></script>
<script src="//ajax.googleapis.com/ajax/libs/jqueryui/1.11.1/jquery-ui.min.js"></script>
</head>
<body style="margin:0px">
<script type="text/javascript">

//
// Execute the following initialization code after the web page is loaded
//
JsChartViewer.addEventListener(window, 'load', function() {
    var viewer = JsChartViewer.get('%(id)s');

    // Draw track cursor when mouse is moving over plotarea or if the chart is updated. In the latter case,
    // if the mouse is not on the plot area, we will update the legend to show the latest data values.
    viewer.attachHandler(["MouseMovePlotArea", "TouchStartPlotArea", "TouchMovePlotArea", "ChartMove",
        "PostUpdate", "Now"], function(e) {
        this.preventDefault(e);   // Prevent the browser from using touch events for other actions
        trackLineLegend(viewer, viewer.getPlotAreaMouseX());
    });

    // When the chart is being updated, by default, an "Updating" box will pop up. In this example, we
    // will disable this box.
    viewer.updatingMsg = "";
});


function myFunction1(){
        tags = ["webcb_2"];


        var my_dictionary = {};
        my_dictionary['Tag'] = tags.join('|');
		console.log("in pop up my_dictionary['Tag']  my_dictionary ##@@@@...",my_dictionary['Tag'] );

        tag = "2FC1_Lighting";
        console.log("in pop up TAG ISS ##@@@@...",tag);
        console.log("in pop up TAG my_dictionary ##@@@@...",my_dictionary[tags[tag]]);
        my_dictionary = {Tag: "webcb_2", webcb_2: "2FC1_Lighting"}
        $.ajax({


            url: '/ajax2/',
            data:my_dictionary,
            cache: false,
            success: function (data) {
                //printData1(data, tags);
            }
      });
                console.log("in pop data ajax2 is ##@@@@...");

    //window.setTimeout(myFunction1, 8000);
}
myFunction1();


$(document).ready(function() {
    var source = new EventSource('/events1/');
    var events_dom = $("#events");
    var greeting_dom = $("#greeting");

    source.addEventListener("text", function(e) {
        var array_data = JSON.parse(e.data)
		//console.log("in tag..",tag);
        printData1(array_data, "")


    });


});

function printData1(data, tags) {
    var str = '';
    var ArrData = [];
    ArrData = data;
	console.log("in ArrData is ##@@@@...",data);
	}


//
// Draw track line with legend
//
function trackLineLegend(viewer, mouseX)
{
    // Remove all previously drawn tracking object
    viewer.hideObj("all");

    // The chart and its plot area
    var c = viewer.getChart();
    var plotArea = c.getPlotArea();

    // Get the data x-value that is nearest to the mouse, and find its pixel coordinate.
    var xValue = c.getNearestXValue(mouseX);
    var xCoor = c.getXCoor(xValue);
    if (xCoor == null)
        return;

    // Draw a vertical track line at the x-position
    viewer.drawVLine("trackLine", xCoor, plotArea.getTopY(), plotArea.getBottomY(), "black 1px dotted");

    // Array to hold the legend entries
    var legendEntries = [];

    // Iterate through all layers to build the legend array
    for (var i = 0; i < c.getLayerCount(); ++i)
    {
        var layer = c.getLayerByZ(i);

        // The data array index of the x-value
        var xIndex = layer.getXIndexOf(xValue);

        // Iterate through all the data sets in the layer
        for (var j = 0; j < layer.getDataSetCount(); ++j)
        {
            var dataSet = layer.getDataSetByZ(j);

            // We are only interested in visible data sets with names, as they are required for legend entries.
            var dataName = dataSet.getDataName();
            var color = dataSet.getDataColor();
            if ((!dataName) || (color == null))
                continue;

            // Build the legend entry, consist of a colored square box, the name and the data value.
            var dataValue = dataSet.getValue(xIndex);
            legendEntries.push("<nobr>" + viewer.htmlRect(7, 7, color) + " " + dataName + ": " +
                ((dataValue == null) ? "N/A" : dataValue.toPrecision(4)) + viewer.htmlRect(20, 0) + "</nobr> ");

            // Draw a track dot for data points within the plot area
            var yCoor = c.getYCoor(dataSet.getPosition(xIndex), dataSet.getUseYAxis());
            if ((yCoor != null) && (yCoor >= plotArea.getTopY()) && (yCoor <= plotArea.getBottomY()))
            {
                viewer.showTextBox("dataPoint" + i + "_" + j, xCoor, yCoor, JsChartViewer.Center,
                    viewer.htmlRect(7, 7, color));
            }
        }
    }

    // Create the legend by joining the legend entries.
    var legend = "<nobr>[" + c.xAxis().getFormattedLabel(xValue, "hh:nn:ss") + "]" + viewer.htmlRect(20, 0) +
        "</nobr> " + legendEntries.reverse().join("");

    // Display the legend on the top of the plot area
    viewer.showTextBox("legend", plotArea.getLeftX(), plotArea.getTopY(), JsChartViewer.BottomLeft, legend,
        "width:" + plotArea.getWidth() + "px;font:bold 11px Arial;padding:3px;-webkit-text-size-adjust:100%%;");
}

//
// Executes once every second to update the countdown display. Updates the chart when the countdown reaches 0.
//
function timerTick()
{
    // Get the update period and the time left
    var updatePeriod = parseInt(document.getElementById("UpdatePeriod").value);
    var timeLeft = Math.min(parseInt(document.getElementById("TimeRemaining").innerHTML), updatePeriod) - 1;

    if (timeLeft == 0)
        // Can update the chart now
        JsChartViewer.get('%(id)s').partialUpdate();
    else if (timeLeft < 0)
        // Reset the update period
        timeLeft += updatePeriod;

    // Update the countdown display
    document.getElementById("TimeRemaining").innerHTML = timeLeft;
}
window.setInterval("timerTick()", 1000);

</script>
<table cellspacing="0" cellpadding="0" border="0">
    <tr>
        <td align="right" colspan="2" style="background:#000088; color:#ffff00; padding:0px 4px 2px 0px;">
            <a style="color:#FFFF00; font:italic bold 10pt Arial; text-decoration:none" href="http://www.advsofteng.com/">
                Advanced Software Engineering
            </a>
        </td>
    </tr>
    <tr valign="top">
        <td style="width:150px; background:#c0c0ff; border-right:black 1px solid; border-bottom:black 1px solid;">
            <br />
            <br />
            <div style="font: 9pt Verdana; padding:10px;">
                <b>Update Period</b><br />
                <select id="UpdatePeriod" style="width:130px">
                    <option value="5">5</option>
                    <option value="10" selected="selected">10</option>
                    <option value="20">20</option>
                    <option value="30">30</option>
                    <option value="60">60</option>
                </select>
            </div>
            <div style="font:9pt Verdana; padding:10px;">
                <b>Time Remaining</b><br />
                <div style="width:128px; border:#888888 1px inset;">
                    <div style="margin:3px" id="TimeRemaining">0</div>
                </div>
            </div>
        </td>
        <td>
            <div style="font: bold 20pt Arial; margin:5px 0px 0px 5px;">
                Realtime Chart with Track Line
            </div>
            <hr style="border:solid 1px #000080" />
            <div style="padding:0px 5px 5px 10px">
                <!-- ****** Here is the chart image ****** -->
                %(chartImg)s
            </div>
        </td>
    </tr>
</table>
</body>
</html>
""" % {
    "loadResource" : loadResource,
    "id" : viewer.getId(),
    "chartImg" : viewer.renderHTML()
    }

def getchart(request) :
	import cgi, sys, string, urllib
	os.environ['QUERY_STRING'] = urllib.parse.urlencode( request.GET )

	query = cgi.FieldStorage()
	filename = query["img"].value
	print("NAMEEEEEEEEEEEEEEEEEEEEE.................",filename)
	if (hasattr(string, "find") and string.find or (lambda a, b: a.find(b)))(filename, "cd__") == -1 :
		raise ('Filename "%s" does not seem created by ChartDirector' % filename)
	extPos = (hasattr(string, "rfind") and string.rfind or (lambda a, b: a.rfind(b)))(filename, ".")
	if extPos == -1 :
		ext = "png"
	else :
		ext = (hasattr(string, "lower") and string.lower or (lambda a: a.lower()))(filename[extPos + 1:])

	contentType = "image/png"
	if ext == "gif" :
		contentType = "image/gif"
	elif ext == "jpg" or ext == "jpeg" :
		contentType = "image/jpeg"
	elif ext == "bmp" :
		contentType = "image/bmp"
	elif ext == "wmp" or ext == "wbmp" :
		contentType = "image/vnd.wap.wbmp"
	elif ext == "svg" or ext == "svgz" :
		contentType = "image/svg+xml"
	elif ext == "pdf" :
		contentType = "application/pdf"
	elif ext == "map" or ext == "gz" :
		contentType = "text/html; charset=utf-8"

	response = HttpResponse( content_type = contentType)
	if ext == "gz" or ext == "svgz" :
		response["Content-Encoding"] = "gzip"
	if (hasattr(query, "has_key") and query.has_key or (lambda a, b = query: a in b))("filename") :
		response["Content-Disposition"] = "inline; filename=%s" % query["filename"].value

	f = open(filename, "rb")
	response.write(f.read())
	f.close()
	return response
|
| |
| Re: Django integration |
| Posted by nmahale on Apr-13-2017 12:31 |
|
Hi Peter,
I am getting data but facing one issue.
Whenever I start real time tend It starts from the 2 minutes prior time.
For e.g I have started at 09:50:15
But trend gets start from 09:48:15.
I want to start the trend from the time I have started it.
Thanks |
| Re: Django integration |
| Posted by nmahale on Apr-13-2017 14:15 |
|
Hi Peter,
I am getting data but facing some issues below.
1. Whenever I start real time tend It starts from the 2 minutes prior time.
For e.g I have started at 09:50:15
But trend gets start from 09:48:15.I want to start the trend from the time I have started it.
2. Plot X axis from start of the graph till latest time.e.g I have started graph at 11:50:55 .It should get started from that time only and it should get continued till graph is open
For example graph is open till 12:20:25. The last time should be 12:20:25
3. I am getting scale at Y axis "50" values separated i.e y axis is 0,50,100,etc.
I want to plot it depending on values e.g. my values are 401.11,401.25,402.12,etc.
So I want scale to be 400.1,400.2,400.3,etc.
4. Plot different Y scales for different parameters.These Y scale spacing will depend on values.These Y axes can be hidden or shown on requirement.
Kindly suggest.
Thanks |
| Re: Django integration |
| Posted by Peter Kwan on Apr-14-2017 03:02 |
|
Hi namhale,
You may have realized that in the original sample code, the x-axis range starts from the starting point of the timestamps. If it is not the case for your code, we can start by analyze what is the difference between your code and the sample code, and between your data and the sample data.
To begin, you may try to display the earliest timestamp of your code, just to verify it is really at the time you think it is at. Your code should have a line:
layer.setXData(timeStamps)
Please add another line after:
c.addTitle(c.formatValue(min(timeStamps), "hh:nn:ss") + " to " + c.formatValue(max(timeStamps), "hh:nn:ss"), "arial.ttf", 8)
This will display the time range in the chart title. Please delete the original addTitle line to avoid having two titles overlapping.
The x-axis range in the sample code is automatically generated by ChartDirector. If your code uses Axis.setDateScale or Axis.setLinearScale, then it is created by your code. In the latter case, if the axis range is not as expected, please check your code to see if it is setting the correct axis scale.
The original sample code is plotting a line chart. If your code is plotting other chart types, there is a chance that ChartDirector will need to add some margins at the axis end points. This is configurable using Axis.setAutoScale and Axis.setRounding.
For the y-axis scale, if your data are 401.11,401.25,402.12, ChartDirector should choose an axis scale like 400.1, 400.2, 400.3. However, if your data are 300, 420, 386.985, ChartDirector may choose 0, 50, 100, .... 450. This is because by default, ChartDirector prefer to start the axis from 0, unless the axis range is "small". By default, "small" means the minimum data value is larger than 80% of the maximum data value. This is configurable using Axis.setAutoScale. In particular, setting the zero affinity parameter to 0 will cause ChartDirector not to prefer starting the axis from 0 at all.
Before you try the above, I suggest you display the minimum value of your data in the chart title just to confirm it is really what you think. The code is like:
c.addTitle("Min = " + min(min(data0), min(data1), min(data2)), "arial.ttf", 8)
The "Multiple Axes" sample code demonstrates how to add multiple y-axes to the chart with different scales based on the data series that you using the axes. The "Zooming and Scrolling with Track Line" sample demonstrates how you can disable and enable individual lines. These techniques should be able to achieve what you need.
Regards
Peter Kwan |
| Re: Django integration |
| Posted by nmahale on Apr-27-2017 19:47 |
|
Hi Peter,
I am using c.yAxis().setAutoScale(0.1,0.5,0) but getting same results.
This is the code I have added for x axis
--->>layer.setXData(timeStamps)
--->>c.addTitle(c.formatValue(min(timeStamps), "hh:nn:ss") + " to " + c.formatValue(max(timeStamps), "hh:nn:ss"), "arial.ttf", 8)
But my X axis showing only 2 minutes data .Start point getting shifted as time moves. |
| Re: Django integration |
| Posted by Peter Kwan on Apr-28-2017 06:32 |
|
Hi nmahale,
To help me troubleshoot your code, is it possible to provide me with your code, and also the chart that is generated (with the code you have added)? It is because it is not possible to know where is the problem in the code if I cannot see the code or its result. If you cannot post the code or the chart in a forum, you can email me at pkwan@advsofteng.net.
Regards
Peter Kwan |
| Re: Django integration |
| Posted by nmahale on Apr-27-2017 20:12 |
|
In addition to above
leftAxis.setAutoScale() is not working.
How to set auto scale to "leftAxis". |
| Re: Django integration |
| Posted by Peter Kwan on Apr-28-2017 06:35 |
|
Hi nmahale,
For the "leftAxis.setAutoScale() is not working", would you mind to clarify why you think it is not working? Again, to diagnose the problem, provide me with your code, and also the chart that is generated, and also please clarify why you think it is not working (what you think should be the expected result).
Regards
Peter Kwan |
|

 Forum Home
 Search
 Message List
 Post Message
 (Peter Kwan)