|
 How color:#000000; background:#ffff99'>to color:#000000; background:#ffff99'>modify color:#000000; background:#ffff99'>the color:#000000; background:#ffff99'>default Concolor:#000000; background:#ffff99'>tour Color Scale? How color:#000000; background:#ffff99'>to color:#000000; background:#ffff99'>modify color:#000000; background:#ffff99'>the color:#000000; background:#ffff99'>default Concolor:#000000; background:#ffff99'>tour Color Scale? |
| Posted by Tim on Jul-27-2016 21:55 |
|
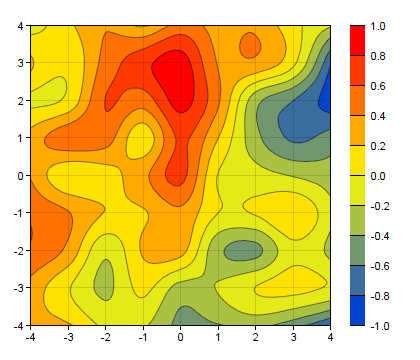
I wish to use the default rainbow color scale, but feel the bottom blue color is too heavy. So my question is how could I modify that to another color, say 0x0044cc.
I have tried to emulate with the following code but it is not that close.
int colorGradient[] = { 0x0044cc, 0xFFFF00, 0xff0000 };
cAxis->setColorGradient(false, IntArray(colorGradient, (int)(sizeof(colorGradient) / sizeof(colorGradient[0]))));
Thanks.
|
| Re: How color:#000000; background:#ffff99'>to color:#000000; background:#ffff99'>modify color:#000000; background:#ffff99'>the color:#000000; background:#ffff99'>default Concolor:#000000; background:#ffff99'>tour Color Scale? |
| Posted by Peter Kwan on Jul-27-2016 23:44 |
|
Hi Tim,
I have added your code to the original "Contour Color Scale" sample code, and it works normally in my case. I have attached my test code (I am using the cpp command line version of the sample code), and the resulting chart for your reference.
If in your case it is not working, is it possible to provide a runnable example (perhaps by modifying the sample code) to help me reproduce the problem?
Regards
Peter Kwan
 |
| contourcolor.cpp |
|---|
#include "chartdir.h"

void createChart(int chartIndex, const char *filename)
{
    // The x and y coordinates of the grid
    double dataX[] = {-4, -3, -2, -1, 0, 1, 2, 3, 4};
    double dataY[] = {-4, -3, -2, -1, 0, 1, 2, 3, 4};

    // Use random numbers for the z values on the XY grid
    RanSeries *r = new RanSeries(99);
    DoubleArray dataZ = r->get2DSeries((int)(sizeof(dataX) / sizeof(dataX[0])), (int)(sizeof(dataY)
         / sizeof(dataY[0])), -0.9, 0.9);

    // Create a XYChart object of size 420 x 360 pixels
    XYChart *c = new XYChart(420, 360);

    // Set the plotarea at (30, 25) and of size 300 x 300 pixels. Use semi-transparent grey
    // (0xdd000000) horizontal and vertical grid lines
    c->setPlotArea(30, 25, 300, 300, -1, -1, -1, 0xdd000000, -1);

    // Set the x-axis and y-axis scale
    c->xAxis()->setLinearScale(-4, 4, 1);
    c->yAxis()->setLinearScale(-4, 4, 1);

    // Add a contour layer using the given data
    ContourLayer *layer = c->addContourLayer(DoubleArray(dataX, (int)(sizeof(dataX) / sizeof(dataX[0
        ]))), DoubleArray(dataY, (int)(sizeof(dataY) / sizeof(dataY[0]))), dataZ);

    // Move the grid lines in front of the contour layer
    c->getPlotArea()->moveGridBefore(layer);

    // Add a color axis (the legend) in which the top left corner is anchored at (350, 25). Set the
    // length to 400 300 and the labels on the right side.
    ColorAxis *cAxis = layer->setColorAxis(350, 25, Chart::TopLeft, 300, Chart::Right);

int colorGradient[] = { 0x0044cc, 0xFFFF00, 0xff0000 };
cAxis->setColorGradient(false, IntArray(colorGradient, (int)(sizeof(colorGradient) / sizeof(colorGradient[0]))));

    if (chartIndex == 1) {
        // Speicify a color gradient as a list of colors, and use it in the color axis.
        int colorGradient[] = {0x0044cc, 0xffffff, 0x00aa00};
        cAxis->setColorGradient(false, IntArray(colorGradient, (int)(sizeof(colorGradient) / sizeof(
            colorGradient[0]))));
    } else if (chartIndex == 2) {
        // Specify the color scale to use in the color axis
        double colorScale[] = {-1.0, 0x1a9850, -0.75, 0x66bd63, -0.5, 0xa6d96a, -0.25, 0xd9ef8b, 0,
            0xfee08b, 0.25, 0xfdae61, 0.5, 0xf46d43, 0.75, 0xd73027, 1};
        cAxis->setColorScale(DoubleArray(colorScale, (int)(sizeof(colorScale) / sizeof(colorScale[0]
            ))));
    } else if (chartIndex == 3) {
        // Specify the color scale to use in the color axis. Also specify an underflow color
        // 0x66ccff (blue) for regions that fall below the lower axis limit.
        double colorScale[] = {0, 0xffff99, 0.2, 0x80cdc1, 0.4, 0x35978f, 0.6, 0x01665e, 0.8,
            0x003c30, 1};
        cAxis->setColorScale(DoubleArray(colorScale, (int)(sizeof(colorScale) / sizeof(colorScale[0]
            ))), 0x66ccff);
    }

    // Output the chart
    c->makeChart(filename);

    //free up resources
    delete r;
    delete c;
}

int main(int argc, char *argv[])
{
    createChart(0, "contourcolor0.png");
    createChart(1, "contourcolor1.png");
    createChart(2, "contourcolor2.png");
    createChart(3, "contourcolor3.png");
    return 0;
}
|
| |
| Re: How color:#000000; background:#ffff99'>to color:#000000; background:#ffff99'>modify color:#000000; background:#ffff99'>the color:#000000; background:#ffff99'>default Concolor:#000000; background:#ffff99'>tour Color Scale? |
| Posted by Tim on Jul-28-2016 11:14 |
|
Thanks, Peter. I tried this before and can produce exactly what you attached. But both color scales are not close enough.
I like the default rainbow color scale (in my attachment) and wish to modify the dark blue color only (at the bottom of the color scale), say set to light blue or a totally different color such as white. That is what I wish to achieve. Any clues?
Tim |
| Re: How color:#000000; background:#ffff99'>to color:#000000; background:#ffff99'>modify color:#000000; background:#ffff99'>the color:#000000; background:#ffff99'>default Concolor:#000000; background:#ffff99'>tour Color Scale? |
| Posted by Peter Kwan on Jul-29-2016 02:00 |
|
Hi Tim,
Sorry for my misunderstanding of your enquiry.
The default rainbow color scale in ChartDirector is fined tuned and composed of many colors as follows:
const int defaultColors[] =
{
0xC0, 0xFF, 0x30FF, 0x60FF, 0x90FF, 0xC0FF, 0x00FFFF, 0x30FFC0,
0x60FF90, 0x90FF60, 0xC0FF30, 0xFFFF00, 0xFFCC00, 0xFF8800, 0xFF5500, 0xFF0000
};
May be you can change the colors in the above list and then apply the modified colors to ColorAxis::setColorGradient.
Regards
Peter Kwan |
| Re: How color:#000000; background:#ffff99'>to color:#000000; background:#ffff99'>modify color:#000000; background:#ffff99'>the color:#000000; background:#ffff99'>default Concolor:#000000; background:#ffff99'>tour Color Scale? |
| Posted by Tim on Jul-29-2016 18:41 |
|
| Thanks, Peter. Your timely and helpful support is marvellous! Tim |
| Re: How color:#000000; background:#ffff99'>to color:#000000; background:#ffff99'>modify color:#000000; background:#ffff99'>the color:#000000; background:#ffff99'>default Concolor:#000000; background:#ffff99'>tour Color Scale? |
| Posted by Tim on Mar-19-2017 22:02 |
|
Hi Peter,
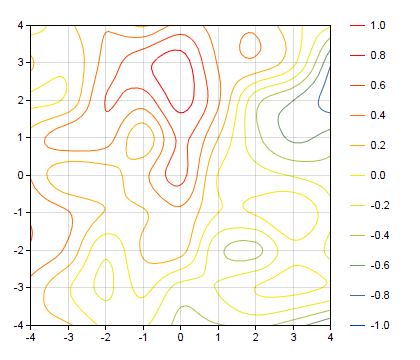
We are really happy with your versatile software, and now have a new task based on what we had produced.
We made one version of the chart using the contour gradient colours, like your example above, which is very good. Now we wish to make another version for displaying the correspondingly-coloured contour lines only! no gradient filling colours. (In this way, we intend to superimpose coloured contours over a picture, and make an easy comparison with the previous chart.)
- I could only figure out setting a single colour for the contours and making all gradient colours transparent. e.g.
layer->setContourColor(0xFFFFFF);
- It seems someone asked a similar question before
http://www.chartdir.com/forum/download_thread.php?bn=chartdir_support&pattern=addContourLayer+set+contour+color&thread=1354965279#N1355159604
but this appears not working at my side.
- Do you have a specific workable example for the task I intend to do? If not, are you able to modify the above code / example to illustrate? In this works, I assume the colour legend would become a set of coloured bars only.
Many thanks
Tim |
| Re: How color:#000000; background:#ffff99'>to color:#000000; background:#ffff99'>modify color:#000000; background:#ffff99'>the color:#000000; background:#ffff99'>default Concolor:#000000; background:#ffff99'>tour Color Scale? |
| Posted by Peter Kwan on Mar-21-2017 03:41 |
|
Hi Tim,
I have attached an example for your reference.
Hope this can help.
Regards
Peter Kwan
 |
| contourcolor.cpp |
|---|
#include "chartdir.h"
#include <algorithm>

void createChart(int chartIndex, const char *filename)
{
    // The x and y coordinates of the grid
    double dataX[] = {-4, -3, -2, -1, 0, 1, 2, 3, 4};
    double dataY[] = {-4, -3, -2, -1, 0, 1, 2, 3, 4};

    // Use random numbers for the z values on the XY grid
    RanSeries *r = new RanSeries(99);
    DoubleArray dataZ = r->get2DSeries((int)(sizeof(dataX) / sizeof(dataX[0])), (int)(sizeof(dataY)
         / sizeof(dataY[0])), -0.9, 0.9);

    // Create a XYChart object of size 420 x 360 pixels
    XYChart *c = new XYChart(420, 360);

    // Set the plotarea at (30, 25) and of size 300 x 300 pixels. Use semi-transparent grey
    // (0xdd000000) horizontal and vertical grid lines
    c->setPlotArea(30, 25, 300, 300, -1, -1, -1, 0xdd000000, -1);

    // Set the x-axis and y-axis scale
    c->xAxis()->setLinearScale(-4, 4, 1);
    c->yAxis()->setLinearScale(-4, 4, 1);

    // Add a contour layer using the given data and with no filling
    ContourLayer *layer = c->addContourLayer(DoubleArray(dataX, (int)(sizeof(dataX) / sizeof(dataX[0
        ]))), DoubleArray(dataY, (int)(sizeof(dataY) / sizeof(dataY[0]))), dataZ);
    int noFillGradient[] = { Chart::Transparent, Chart::Transparent };
    ColorAxis *cAxis = layer->setColorAxis(350, 25, Chart::TopLeft, 300, Chart::Right);
    cAxis->setColorGradient(false, IntArray(noFillGradient, (int)(sizeof(noFillGradient) / sizeof(noFillGradient[0]))));
    layer->setContourColor(Chart::Transparent);

    // Move the grid lines in front of the contour layer
    c->getPlotArea()->moveGridBefore(layer);

    // Use a second empty contour layer for the color axis
    ContourLayer *layer2 = c->addContourLayer(DoubleArray(), DoubleArray(), DoubleArray());
    ColorAxis *cAxis2 = layer2->setColorAxis(-350, 25, Chart::TopLeft, 300, Chart::Right);
    int colorGradient[] = { 0x0044cc, 0xFFFF00, 0xff0000 };
    cAxis2->setColorGradient(false, IntArray(colorGradient, (int)(sizeof(colorGradient) / sizeof(colorGradient[0]))));
    cAxis2->setLinearScale(*(std::min_element(dataZ.data, dataZ.data + dataZ.len)),
        *(std::max_element(dataZ.data, dataZ.data + dataZ.len)));

    c->layout();

    DoubleArray ticks = cAxis->getTicks();
    for (int i = 0; i < ticks.len; ++i)
        cAxis->addMark(ticks[i], cAxis2->getColor(ticks[i]));

    // Output the chart
    c->makeChart(filename);

    //free up resources
    delete r;
    delete c;
}

int main(int argc, char *argv[])
{
    createChart(0, "test.png");
    return 0;
}
|
| |
| Re: How color:#000000; background:#ffff99'>to color:#000000; background:#ffff99'>modify color:#000000; background:#ffff99'>the color:#000000; background:#ffff99'>default Concolor:#000000; background:#ffff99'>tour Color Scale? |
| Posted by Tim on Mar-21-2017 20:41 |
|
Hi Peter,
Definitely helped. Thank you!
My initial thought is that you could include such an example in your software Help file. I see this is a popular task for many potential users.
From here we have found new uses of your software. We plan to license another copy soon.
Best wishes
Tim |
| Re: How color:#000000; background:#ffff99'>to color:#000000; background:#ffff99'>modify color:#000000; background:#ffff99'>the color:#000000; background:#ffff99'>default Concolor:#000000; background:#ffff99'>tour Color Scale? |
| Posted by Peter Kwan on Mar-22-2017 14:56 |
|
Hi Tim,
We have taken note of this and will consider to create a new API to allow this type of chart to be created easily.
Regards
Peter Kwan |
| Re: How color:#000000; background:#ffff99'>to color:#000000; background:#ffff99'>modify color:#000000; background:#ffff99'>the color:#000000; background:#ffff99'>default Concolor:#000000; background:#ffff99'>tour Color Scale? |
| Posted by Tim on Mar-24-2017 22:33 |
|
Hi Peter,
Is there any parameter to control the smoothness of the contour LINES? I note that for the same dataset, the smoothness of the contour LINES specifically with the second smallest value (say, 0 in the contour value series -2, 0, 2, 4, 6, 8, 10; i.e. the first contour line) is artificially distorted (with a few small circles) while this ought to be a rigid boundary, say land/sea boundary. In the contour chart with filled color gradients, the boundary displays correctly.
I provide an illustration below.
Thanks
Tim
|
| Re: How color:#000000; background:#ffff99'>to color:#000000; background:#ffff99'>modify color:#000000; background:#ffff99'>the color:#000000; background:#ffff99'>default Concolor:#000000; background:#ffff99'>tour Color Scale? |
| Posted by Peter Kwan on Mar-25-2017 03:34 |
|
Hi Tim,
Are the two charts using exactly the same data and interpolation method?
If your code has used ContourLayer.setSmoothInterpolation(false), please make sure it is applied to both ContourLayer objects in the "contour only" chart.
For your actual data, it is that the "sea" in your map has zero z values? In smooth interpolation, it is possible to undershoot and overshoot. The following is an explanation why the undershooting or overshooting can occur in order to maintain smoothness.
http://www.chartdir.com/forum/download_thread.php?bn=chartdir_support&thread=1316002140#N1316017487
If there is a large area in the chart at z = 0, it is possible there is some small undershooting at the border between the land and the sea. For example, the z value can undershoot to z = -0.01, and then rise back to z = 0. It happens z = 0 is a contour level, so even extremely small undershooting or overshooting can generate additional z = 0 boundaries and hence the extra contour.
One method to address this issue is to use bilinear interpolation which cannot overshoot or undershoot. Another method is to use ContourLayer.setZBounds to limit the lower bound of the interpolated z to 0. This avoids undershooting to negative values.
Regards
Peter Kwan |
| Re: How color:#000000; background:#ffff99'>to color:#000000; background:#ffff99'>modify color:#000000; background:#ffff99'>the color:#000000; background:#ffff99'>default Concolor:#000000; background:#ffff99'>tour Color Scale? |
| Posted by Tim on Mar-25-2017 21:36 |
|
Hi Peter,
Thanks for your thorough analysis and suggestions. From the underlying theory to easy functions, you have explained so well.
For my case, it turns out that I did not use setSmoothInterpolation(false) consistently in two cases.
Best,
Tim |
|

 Forum Home
 Search
 Message List
 Post Message
 (Tim)
(Tim)