|
 Volume by price (Market profile) Volume by price (Market profile) |
| Posted by newtrader on Oct-17-2012 13:47 |
|
Hi
I have altered by datasets so that it has volume by price data. I want to create a bar chart
on back of price-volume(OHLC) chart showing the market profile. I just need a simple
example in php for doing so using FinanceChart.
Thanks |
| Re: Volume by price (Market profile) |
| Posted by Peter Kwan on Oct-18-2012 04:49 |
|
Hi newtrader,
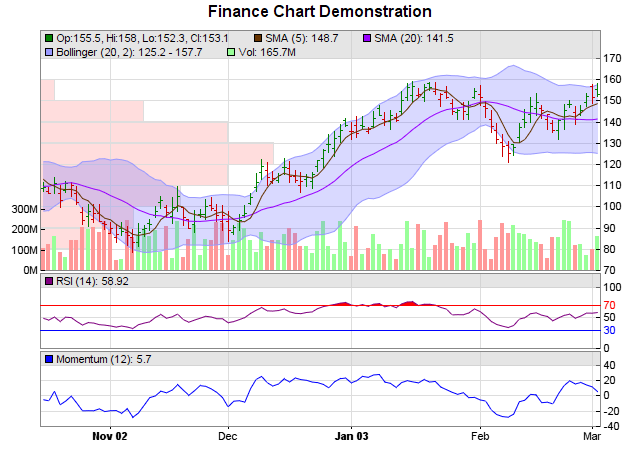
I have attached an example for your reference. Basically, you can create an XYChart for the price volume bar chart, and put it at the back of the main price chart. You need to set up the XYChart so that it fits in the plot area of the main price chart, and that the price axis scale is the same as that of the main price chart.
Hope this can help.
Regards
Peter Kwan
 |
| finance.php |
|---|
<?php
require_once("../lib/FinanceChart.php");

# Create a finance chart demo containing 100 days of data
$noOfDays = 100;

# To compute moving averages starting from the first day, we need to get extra data
# points before the first day
$extraDays = 30;

# In this exammple, we use a random number generator utility to simulate the data. We
# set up the random table to create 6 cols x (noOfDays + extraDays) rows, using 9 as
# the seed.
$rantable = new RanTable(9, 6, $noOfDays + $extraDays);

# Set the 1st col to be the timeStamp, starting from Sep 4, 2002, with each row
# representing one day, and counting week days only (jump over Sat and Sun)
$rantable->setDateCol(0, chartTime(2002, 9, 4), 86400, true);

# Set the 2nd, 3rd, 4th and 5th columns to be high, low, open and close data. The
# open value starts from 100, and the daily change is random from -5 to 5.
$rantable->setHLOCCols(1, 100, -5, 5);

# Set the 6th column as the vol data from 5 to 25 million
$rantable->setCol(5, 50000000, 250000000);

# Now we read the data from the table into arrays
$timeStamps = $rantable->getCol(0);
$highData = $rantable->getCol(1);
$lowData = $rantable->getCol(2);
$openData = $rantable->getCol(3);
$closeData = $rantable->getCol(4);
$volData = $rantable->getCol(5);

# Create a FinanceChart object of width 640 pixels
$c = new FinanceChart(640);

# Add a title to the chart
$c->addTitle("Finance Chart Demonstration");

# Set the data into the finance chart object
$c->setData($timeStamps, $highData, $lowData, $openData, $closeData, $volData,
    $extraDays);

# Add the main chart with 240 pixels in height
$mainPriceChart = $c->addMainChart(240);

# Add a 5 period simple moving average to the main chart, using brown color
$c->addSimpleMovingAvg(5, 0x663300);

# Add a 20 period simple moving average to the main chart, using purple color
$c->addSimpleMovingAvg(20, 0x9900ff);

# Add HLOC symbols to the main chart, using green/red for up/down days
$c->addHLOC(0x008000, 0xcc0000);

# Add 20 days bollinger band to the main chart, using light blue (9999ff) as the
# border and semi-transparent blue (c06666ff) as the fill color
$c->addBollingerBand(20, 2, 0x9999ff, 0xc06666ff);

# Add a 75 pixels volume bars sub-chart to the bottom of the main chart, using
# green/red/grey for up/down/flat days
$c->addVolBars(75, 0x99ff99, 0xff9999, 0x808080);

# Append a 14-days RSI indicator chart (75 pixels high) after the main chart. The
# main RSI line is purple (800080). Set threshold region to +/- 20 (that is, RSI = 50
# +/- 25). The upper/lower threshold regions will be filled with red (ff0000)/blue
# (0000ff).
$c->addRSI(75, 14, 0x800080, 20, 0xff0000, 0x0000ff);

# Append a 12-days momentum indicator chart (75 pixels high) using blue (0000ff)
# color.
$c->addMomentum(75, 12, 0x0000ff);

#
# Create the price volume chart
#
$price = array(75, 85, 95, 105, 115, 125, 135, 145, 155, 165);
$volume = array(0, 10, 20, 30, 40, 50, 40, 22, 3, 0);

$mainPlotArea = $mainPriceChart->getPlotArea();

# Size of price volume chart = size of the plot area of the main price chart
$pvChart = new XYChart($mainPlotArea->getWidth(), $mainPlotArea->getHeight());
$pvChart->setPlotArea(0, 0, $pvChart->getWidth(), $pvChart->getHeight(), Transparent, -1, Transparent, Transparent);

# Add the bar layer
$pvChart->swapXY();
$barLayer = $pvChart->addBarLayer($volume, 0xffdddd);
$barLayer->setBorderColor(0xdddddd);
$barLayer->setXData($price);
$barLayer->setBarGap(TouchBar);

# The x-axis of the pvChart is the same as the y-axis of the main price chart
$pvChart->xAxis()->syncAxis($mainPriceChart->yAxis());
$pvChart->yAxis()->setMargin($pvChart->getWidth() / 2);

# Merge the pvChart to the back of the main price chart
$c->layout();
$mainPlotArea->setBackground(Transparent, Transparent, 0x888888);
$mainPriceChart->getDrawArea()->merge($pvChart->makeChart3(), $mainPlotArea->getLeftX(), $mainPlotArea->getTopY(), TopLeft, 0);

# Output the chart
header("Content-type: image/png");
print($c->makeChart2(PNG));
?>
|
| |
| Re: Volume by price (Market profile) |
| Posted by karl on Jul-15-2015 15:47 |
|
Hi Peter,
I have tried the same but with track lines enabled. I have included all javascript related code.
# Output the chart
#header("Content-type: image/png");
#print($c->makeChart2(PNG));
# Output the chart
$chartQuery = $c->makeSession($viewer->getId());
# Set the chart URL to the viewer
$viewer->setImageUrl("getchart.php?" . $chartQuery);
# Output Javascript chart model to the browser to support tracking cursor
$viewer->setChartModel($c->getJsChartModel());
However this does not seem to work.
Can you please help me here?
Thanks!
Peter Kwan wrote:
Hi newtrader,
I have attached an example for your reference. Basically, you can create an XYChart for the price volume bar chart, and put it at the back of the main price chart. You need to set up the XYChart so that it fits in the plot area of the main price chart, and that the price axis scale is the same as that of the main price chart.
Hope this can help.
Regards
Peter Kwan
|
| Re: Volume by price (Market profile) |
| Posted by Peter Kwan on Jul-16-2015 02:33 |
|
Hi karl,
The track lines need quite a few lines of code. From your last message, I am not sure if you
have added the necessary code. For example, have you created the WebChartViewer,
included the cdjcv.js and other necessary Javascript and HTML code?
I started from the "Finance Chart with Track Line" sample code, and essentially copy and
paste the finance chart code in this thread to the "Finance Chart with Track Line" sample
code, and it works normally. I have attached my test code for your reference.
Hope this can help.
Regards
Peter Kwan
| trackfinance.php |
|---|
<?php
require_once("../lib/FinanceChart.php");
# Create a finance chart demo containing 100 days of data
$noOfDays = 100;
# To compute moving averages starting from the first day, we need to get extra data
# points before the first day
$extraDays = 30;
# In this exammple, we use a random number generator utility to simulate the data. We
# set up the random table to create 6 cols x (noOfDays + extraDays) rows, using 9 as
# the seed.
$rantable = new RanTable(9, 6, $noOfDays + $extraDays);
# Set the 1st col to be the timeStamp, starting from Sep 4, 2002, with each row
# representing one day, and counting week days only (jump over Sat and Sun)
$rantable->setDateCol(0, chartTime(2002, 9, 4), 86400, true);
# Set the 2nd, 3rd, 4th and 5th columns to be high, low, open and close data. The
# open value starts from 100, and the daily change is random from -5 to 5.
$rantable->setHLOCCols(1, 100, -5, 5);
# Set the 6th column as the vol data from 5 to 25 million
$rantable->setCol(5, 50000000, 250000000);
# Now we read the data from the table into arrays
$timeStamps = $rantable->getCol(0);
$highData = $rantable->getCol(1);
$lowData = $rantable->getCol(2);
$openData = $rantable->getCol(3);
$closeData = $rantable->getCol(4);
$volData = $rantable->getCol(5);
# Create a FinanceChart object of width 640 pixels
$c = new FinanceChart(640);
# Add a title to the chart
$c->addTitle("Finance Chart Demonstration");
# Disable default legend box, as we are using dynamic legend
$c->setLegendStyle("normal", 8, Transparent, Transparent);
# Set the data into the finance chart object
$c->setData($timeStamps, $highData, $lowData, $openData, $closeData, $volData,
$extraDays);
# Add the main chart with 240 pixels in height
$mainPriceChart = $c->addMainChart(240);
# Add a 5 period simple moving average to the main chart, using brown color
$c->addSimpleMovingAvg(5, 0x663300);
# Add a 20 period simple moving average to the main chart, using purple color
$c->addSimpleMovingAvg(20, 0x9900ff);
# Add HLOC symbols to the main chart, using green/red for up/down days
$c->addHLOC(0x008000, 0xcc0000);
# Add 20 days bollinger band to the main chart, using light blue (9999ff) as the
# border and semi-transparent blue (c06666ff) as the fill color
$c->addBollingerBand(20, 2, 0x9999ff, 0xc06666ff);
# Add a 75 pixels volume bars sub-chart to the bottom of the main chart, using
# green/red/grey for up/down/flat days
$c->addVolBars(75, 0x99ff99, 0xff9999, 0x808080);
# Append a 14-days RSI indicator chart (75 pixels high) after the main chart. The
# main RSI line is purple (800080). Set threshold region to +/- 20 (that is, RSI = 50
# +/- 25). The upper/lower threshold regions will be filled with red (ff0000)/blue
# (0000ff).
$c->addRSI(75, 14, 0x800080, 20, 0xff0000, 0x0000ff);
# Append a 12-days momentum indicator chart (75 pixels high) using blue (0000ff)
# color.
$c->addMomentum(75, 12, 0x0000ff);
#
# Create the price volume chart
#
$price = array(75, 85, 95, 105, 115, 125, 135, 145, 155, 165);
$volume = array(0, 10, 20, 30, 40, 50, 40, 22, 3, 0);
$mainPlotArea = $mainPriceChart->getPlotArea();
# Size of price volume chart = size of the plot area of the main price chart
$pvChart = new XYChart($mainPlotArea->getWidth(), $mainPlotArea->getHeight());
$pvChart->setPlotArea(0, 0, $pvChart->getWidth(), $pvChart->getHeight(), Transparent, -1, Transparent, Transparent);
# Add the bar layer
$pvChart->swapXY();
$barLayer = $pvChart->addBarLayer($volume, 0xffdddd);
$barLayer->setBorderColor(0xdddddd);
$barLayer->setXData($price);
$barLayer->setBarGap(TouchBar);
# The x-axis of the pvChart is the same as the y-axis of the main price chart
$pvChart->xAxis()->syncAxis($mainPriceChart->yAxis());
$pvChart->yAxis()->setMargin($pvChart->getWidth() / 2);
# Merge the pvChart to the back of the main price chart
$c->layout();
$mainPlotArea->setBackground(Transparent, Transparent, 0x888888);
$mainPriceChart->getDrawArea()->merge($pvChart->makeChart3(), $mainPlotArea->getLeftX(), $mainPlotArea->getTopY(), TopLeft, 0);
# Create the WebChartViewer object
$viewer = new WebChartViewer("chart1");
# Output the chart
$chartQuery = $c->makeSession($viewer->getId());
# Set the chart URL to the viewer
$viewer->setImageUrl("getchart.php?".$chartQuery);
# Output Javascript chart model to the browser to support tracking cursor
$viewer->setChartModel($c->getJsChartModel());
?>
<!DOCTYPE html>
<html>
<head>
<title>Finance Chart Track Line</title>
<script type="text/javascript" src="cdjcv.js"></script>
</head>
<body style="margin:5px 0px 0px 5px">
<script type="text/javascript">
//
// Use the window load event to set up the MouseMovePlotArea event handler
//
JsChartViewer.addEventListener(window, 'load', function() {
var viewer = JsChartViewer.get('<?php echo $viewer->getId()?>');
// Draw track cursor when mouse is moving over plotarea
viewer.attachHandler(["MouseMovePlotArea", "TouchStartPlotArea", "TouchMovePlotArea", "ChartMove", "Now"],
function(e) {
this.preventDefault(e); // Prevent the browser from using touch events for other actions
traceFinance(viewer, viewer.getPlotAreaMouseX());
});
});
//
// Draw finance chart track line with legend
//
function traceFinance(viewer, mouseX)
{
// Remove all previously drawn tracking object
viewer.hideObj("all");
// It is possible for a FinanceChart to be empty, so we need to check for it.
if (!viewer.getChart())
return;
// Get the data x-value that is nearest to the mouse
var xValue = viewer.getChart().getNearestXValue(mouseX);
// Iterate the XY charts (main price chart and indicator charts) in the FinanceChart
var c = null;
for (var i = 0; i < viewer.getChartCount(); ++i)
{
c = viewer.getChart(i);
// Variables to hold the legend entries
var ohlcLegend = "";
var legendEntries = [];
// Iterate through all layers to build the legend array
for (var j = 0; j < c.getLayerCount(); ++j)
{
var layer = c.getLayerByZ(j);
var xIndex = layer.getXIndexOf(xValue);
var dataSetCount = layer.getDataSetCount();
// In a FinanceChart, only layers showing OHLC data can have 4 data sets
if (dataSetCount == 4)
{
var highValue = layer.getDataSet(0).getValue(xIndex);
var lowValue = layer.getDataSet(1).getValue(xIndex);
var openValue = layer.getDataSet(2).getValue(xIndex);
var closeValue = layer.getDataSet(3).getValue(xIndex);
if (closeValue == null)
continue;
// Build the OHLC legend
ohlcLegend =
"Open: " + openValue.toPrecision(4) + ", High: " + highValue.toPrecision(4) +
", Low: " + lowValue.toPrecision(4) + ", Close: " + closeValue.toPrecision(4);
// We also draw an upward or downward triangle for up and down days and the % change
var lastCloseValue = layer.getDataSet(3).getValue(xIndex - 1);
if (lastCloseValue != null)
{
var change = closeValue - lastCloseValue;
var percent = change * 100 / closeValue;
if (change >= 0)
ohlcLegend += " <span style='color:#008800;'>▲ ";
else
ohlcLegend += " <span style='color:#CC0000;'>▼ ";
ohlcLegend += change.toPrecision(4) + " (" + percent.toFixed(2) + "%)</span>";
}
// Add a spacer box, and make sure the line does not wrap within the legend entry
ohlcLegend = "<nobr>" + ohlcLegend + viewer.htmlRect(20, 0) + "</nobr> ";
}
else
{
// Iterate through all the data sets in the layer
for (var k = 0; k < dataSetCount; ++k)
{
var dataSet = layer.getDataSetByZ(k);
var name = dataSet.getDataName();
var value = dataSet.getValue(xIndex);
if ((!name) || (value == null))
continue;
// In a FinanceChart, the data set name consists of the indicator name and its latest value. It is
// like "Vol: 123M" or "RSI (14): 55.34". As we are generating the values dynamically, we need to
// extract the indictor name out, and also the volume unit (if any).
// The unit character, if any, is the last character and must not be a digit.
var unitChar = name.charAt(name.length - 1);
if ((unitChar >= '0') && (unitChar <= '9'))
unitChar = '';
// The indicator name is the part of the name up to the colon character.
var delimiterPosition = name.indexOf(':');
if (delimiterPosition != -1)
name = name.substring(0, delimiterPosition);
// In a FinanceChart, if there are two data sets, it must be representing a range.
if (dataSetCount == 2)
{
// We show both values in the range
var value2 = layer.getDataSetByZ(1 - k).getValue(xIndex);
name = name + ": " + Math.min(value, value2).toPrecision(4) + " - "
+ Math.max(value, value2).toPrecision(4);
}
else
{
// In a FinanceChart, only the layer for volume bars has 3 data sets for up/down/flat days
if (dataSetCount == 3)
{
// The actual volume is the sum of the 3 data sets.
value = layer.getDataSet(0).getValue(xIndex) + layer.getDataSet(1).getValue(xIndex) +
layer.getDataSet(2).getValue(xIndex);
}
// Create the legend entry
name = name + ": " + value.toPrecision(4) + unitChar;
}
// Build the legend entry, consist of a colored square box and the name (with the data value in it).
legendEntries.push("<nobr>" + viewer.htmlRect(5, 5, dataSet.getDataColor(),
"solid 1px black") + " " + name + viewer.htmlRect(20, 0) + "</nobr>");
}
}
}
// The legend is formed by concatenating the legend entries.
var legend = legendEntries.reverse().join(" ");
// Add the date and the ohlcLegend (if any) at the beginning of the legend
legend = "<nobr>[" + c.xAxis().getFormattedLabel(xValue, "mmm dd, yyyy") + "]" + viewer.htmlRect(20, 0) +
"</nobr> " + ohlcLegend + legend;
// Get the plot area position relative to the entire FinanceChart
var plotArea = c.getPlotArea();
var plotAreaLeftX = plotArea.getLeftX() + c.getAbsOffsetX();
var plotAreaTopY = plotArea.getTopY() + c.getAbsOffsetY();
// Draw a vertical track line at the x-position
viewer.drawVLine("trackLine" + i, c.getXCoor(xValue) + c.getAbsOffsetX(), plotAreaTopY,
plotAreaTopY + plotArea.getHeight(), "black 1px dotted");
// Display the legend on the top of the plot area
viewer.showTextBox("legend" + i, plotAreaLeftX + 1, plotAreaTopY + 1, JsChartViewer.TopLeft, legend,
"padding-left:5px;width:" + (plotArea.getWidth() - 1) + "px;font:11px Arial;-webkit-text-size-adjust:100%;");
}
}
</script>
<div style="font-size:18pt; font-family:verdana; font-weight:bold">
Finance Chart Track Line
</div>
<hr style="border:solid 1px #000080" />
<div style="font-size:10pt; font-family:verdana; margin-bottom:1.5em">
<a href="viewsource.php?file=<?php echo $_SERVER["SCRIPT_NAME"]?>">View Source Code</a>
</div>
<!-- ****** Here is the chart image ****** -->
<?php echo $viewer->renderHTML()?>
</body>
</html>
|
| |
| Re: Volume by price (Market profile) |
| Posted by karl on Jul-16-2015 11:39 |
|
Hi Peter,
Yes I was having javascript code. The problem was that I was trying to add the code before candle stick chart. Thanks It worked like a charm.
I have another question here. I want to add another volume profile at the right end of the finance chart along with the one in the code. Can you help me here?
Thanks! |
| Re: Volume by price (Market profile) |
| Posted by Peter Kwan on Jul-17-2015 02:08 |
|
Hi karl,
To create another volume profile, you just need to use code similar to that creates the bars
on the left side. To make the bars on the right size, you can use Axis.setReverse on the y-
axis to reverse the direction of the y-axis (which is the horizontal axis as swapXY is in
effect).
Regards
Peter Kwan |
| Re: Volume by price (Market profile) |
| Posted by karl on Jul-17-2015 14:18 |
|
Hi Peter,
I have tried that. But the charts overlap and only 1(second one) is being shown.
So I would like to shift the second chart towards the right end of X axis so that i can see both profiles.
I have tried changing the X values of below lines. No luck though.
$pvChart->setPlotArea(0, 0, $pvChart->getWidth(), $pvChart->getHeight(), Transparent, -1, Transparent, Transparent);
$mainChart->getDrawArea()->merge($pvChart->makeChart3(), $mainPlotArea->getLeftX(), $mainPlotArea->getTopY(), TopLeft, 0);
Snippet below:
$mainPlotArea = $mainChart->getPlotArea();
# Size of price volume chart = size of the plot area of the main price chart
$pvChart = new XYChart($mainPlotArea->getWidth(), $mainPlotArea->getHeight());
$pvChart->setPlotArea(0, 0, $pvChart->getWidth(), $pvChart->getHeight(), Transparent, -1, Transparent, Transparent);
# Add the bar layer
$pvChart->swapXY();
#$barLayer = $pvChart->addBarLayer($aggrData, 0xF7D358);
$layer = $pvChart->addBarLayer2(Overlay);
# Select positive data and add it as data set with blue (6666ff) color
$tmpArrayMath1 = new ArrayMath($aggrData);
$tmpArrayMath1->selectGEZ(null, NoValue);
$layer->addDataSet($tmpArrayMath1->result(), 0x58FAD0);
$tmpArrayMath1 = new ArrayMath($aggrData);
$tmpArrayMath1->selectLTZ(null, NoValue);
$layer->addDataSet($tmpArrayMath1->result(), 0xF5D0A9);
$layer->setBorderColor(Transparent);
#$barLayer->setBorderColor(0xF7D358);
$layer->setXData($aggrPrData);
$layer->setBarGap(0);
#$layed->moveFront();
# The x-axis of the pvChart is the same as the y-axis of the main price chart
$pvChart->xAxis()->syncAxis($mainChart->yAxis());
$pvChart->yAxis()->setMargin($pvChart->getWidth()/1.5 );
$c->layout();
$mainPlotArea->setBackground(Transparent, Transparent, 0x888888);
$mainChart->getDrawArea()->merge($pvChart->makeChart3(), $mainPlotArea->getLeftX(), $mainPlotArea->getTopY(), TopLeft, 0);
#---------------------------------------------------second -------------------------------------------------------------------------------
$pvChart1 = new XYChart($mainPlotArea->getWidth(), $mainPlotArea->getHeight());
$pvChart1->setPlotArea(0, 0, $pvChart->getWidth(), $pvChart->getHeight(), Transparent, -1, Transparent, Transparent);
# Add the bar layer
$pvChart1->swapXY();
$layer = $pvChart1->addBarLayer($aggrVolData, 0xF7D358);
$layer->setBorderColor(Transparent);
#$barLayer->setBorderColor(0xF7D358);
$layer->setXData($aggrPrDataV);
$layer->setBarGap(0);
#$layed->moveFront();
# The x-axis of the pvChart is the same as the y-axis of the main price chart
$pvChart1->xAxis()->syncAxis($mainChart->yAxis());
$pvChart1->yAxis()->setMargin($pvChart1->getWidth()/1.5 );
$pvChart1->yAxis()->setReverse();
$c->layout();
$mainPlotArea->setBackground(Transparent, Transparent, 0x888888);
$mainChart->getDrawArea()->merge($pvChart1->makeChart3(), $mainPlotArea->getLeftX()*2, $mainPlotArea->getTopY(), TopLeft, 0);
##----------------------------------------------------------------------------------------------------------------------------------
Thanks
Karl |
| Re: Volume by price (Market profile) |
| Posted by karl on Jul-18-2015 00:17 |
|
Hi Peter,
FIxed the issue. Below +300 is the trick.
$mainChart->getDrawArea()->merge($pvChart->makeChart3(), $mainPlotArea-
>getLeftX()+300, $mainPlotArea->getTopY(), TopLeft, 0);
Just 1 doubt. I need to push the grid lines behind my volume profile. Currently the grid
layer is on top of profile layer. I have checked setLayer does my need.
But not sure which layer should I pass to it.
Thanks
Karl |
| Re: Volume by price (Market profile) |
| Posted by Peter Kwan on Jul-18-2015 08:40 |
|
Hi Karl,
I have not tried myself but here is one idea. You can make the grid lines transparent in the
top chart (the $mainChart) and non-transparent at the bottom chart (the $pvChart). In this
way, you can put the grid lines behind the bottom chart.
For the middle chart $pvChart1, you can consider to use a transparent background (the
third argument to "new XYChart" can be set the Transparent) to avoid it from blocking the
bottom chart.
Hope this can help.
Regards
Peter Kwan |
| Re: Volume by price (Market profile) |
| Posted by karl on Jul-18-2015 19:43 |
|
Thanks Peter.
In the below chart I have a set of scatter points in an array.
Im plotting this on a finance chart. This works when I have 1 point for each x axis
timestamp. I may sometimes have 2-3 points for a single X coordinate. Since I cannot
pass $timestamp which is my X-axis data, how can I enable this?
$mainChart->addScatterLayer(Nothing, $arr1, "", CircleSymbol, 4, 0xFACC2E, 0xFACC2E
|
| Re: Volume by price (Market profile) |
| Posted by Peter Kwan on Jul-21-2015 03:28 |
|
Hi karl,
You can use x-coordinates as usual in addScatterLayer.
Please note that in ChartDirector, a financial chart does not use timestamps as x-
coordinates. It is because the timestamps are somewhat "random". For example, the
timestamps include only trading days. They do not include saturdays or sundays or other
special holidays, or non-trading days due to unpredictable natural phenomena (eg. hurricane
or typhoon) or other unpredictable factors. Yet the spacing between the candlesticks are
always the same regardless of the duration between them. It means the timestamps are
just names for human reading and do not reflect the position of the data points. That is
why all common technical indicators do not use timestamps in their computation.
In ChartDirector, for financial chart, the x-coordinates are the trading session number,
which is simply 0, 1, 2, .... for the first, second, third .... trading sessions on the chart, in
which the first trading session is the one at the left-most position of the plot area. Also, in
a financial chart, the first "extraPoints" are removed before plotting. For example, if
extraPoints is set to 30, the first 30 elements in the data arrays are not plotted. This is the
same for all technical indicators.
So for your case, if you would like to use x-coordinates, please use the trading session
number as the x-coordinates. Also, please note that the first extraPoints of elements of the
arrays are not plotted.
Hope this can help.
Regards
Peter Kwan |
| Re: Volume by price (Market profile) |
| Posted by karl on Jul-25-2015 01:46 |
|
Hi Peter,
I have tried the same.
$ii = 0;
for( $ii=0; $ii<=$extraDays; $ii++ )
{
array_push ( $arrTsCE , $ii);
}
foreach ( $timeStamps as &$value ) {
foreach ( $hashOI["$value"]['AAPL'] as &$val ) {
#echo "test " . $value . " - ";
array_push ( $arrTsCE , $ii);
array_push( $arrCE , $val) ;
$ii++;
}
}
$mainChart->addScatterLayer($arrTsCE, $arrCE, "", CircleSymbol, 4, 0xFACC2E,
0xFACC2E);
I see the points getting scattered after the end of day. I just created the X-array including
extradays.
|
| Re: Volume by price (Market profile) |
| Posted by Peter Kwan on Jul-25-2015 05:22 |
|
Hi Karl,
There are several issues.
(1) The first extraDays of all data arrays are not plotted. This includes not only $arrTsCE,
but $arrCE as well. Also, it is the first $extraDays, not ($extraDays + 1). (The "$ii <=
$extraDays" should be "$ii < $extraDays".)
$ii = 0;
for( $ii=0; $ii < $extraDays; $ii++ )
{
array_push ( $arrTsCE , NoValue);
array_push ( $arrCE, NoValue);
}
(2) I am not sure what is $timeStamps in your code. If $timeStamps are the data your
code provided to FinanceChart, then the first $extraDays are not plotted, but in your
code, it seems to add all of them to $arrTsCE. Furthermore, the first $timeStamps value
(which may not be visible at all due to the $extraDays) is added at ($extraDays + 1),
which is the incorrect coordinate. Also, in your code, every symbol is added at the next
x-coordinate (because your code increments $ii for every symbol), so no two symbols are
at the same x-coordinate, and the $ii will like to be incremented so the points go way
beyond the last $timeStamps value.
The x-coordinates should be 0, 1, 2, ..... for the first, second and third visible
candlesticks. If you need two symbols to be at the same x-coordinates, please use the
same x-coordinate for the two symbols.
for ($i = $extraDays; $i < count($timeStamps); ++$i) {
$value = $timeStamps[$i];
foreach ( $hashOI["$value"]['AAPL'] as &$val ) {
array_push ($arrTsCE , $i - $extraDays);
array_push($arrCE , $val) ;
}
}
Hope this can help.
Regards
Peter Kwan |
|

 Forum Home
 Search
 Message List
 Post Message
 (Peter Kwan)